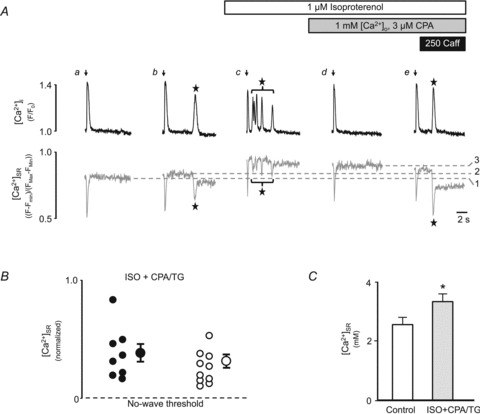
Figure 4. Isoproterenol increases the intra-SR Ca2+ wave threshold, determined by direct [Ca2+]SR measurements.

A, simultaneous [Ca2+]i (rhod-2, upper traces in black) and [Ca2+]SR (fluo-5N, lower traces in grey) measurements following rest from electrical stimulation (arrows) under control conditions (a: 7 mm[Ca2+]o, 0.7 Hz; b: 7 mm[Ca2+]o, 0.75 Hz), in the presence of ISO (c: 2 mm[Ca2+]o, 0.75 Hz) and in the presence of ISO with 3 μm CPA (d and e: 1 mm[Ca2+]o, 0.75 Hz). Dashed lines: 1, no-wave, threshold control; 2, wave threshold, control; 3, no-wave threshold, ISO. Subsequent application of 250 μm caffeine induced a Ca2+ wave (e). Waves are marked by stars. B, normalized [Ca2+]SR values from 18 individual experimental trials (from 12 cells) in ISO+CPA/TG separated by the criteria whether waves were observed (filled circle) or not (open circles), together with the mean ± SEM of [Ca2+]SR for the two groups. For each individual trial [Ca2+]SR was normalized to the maximal fluorescence observed in the presence of 1 μm ISO ([Ca2+]SR,normalized= 1) and the no-wave threshold under control conditions ([Ca2+]SR,normalized= 0). C, quantification of the [Ca2+]SR associated with the no-wave threshold under control conditions (open bar) and in the presence of ISO+CPA/TG (shaded bar). *P < 0.002 vs. control, n= 7 cells.
