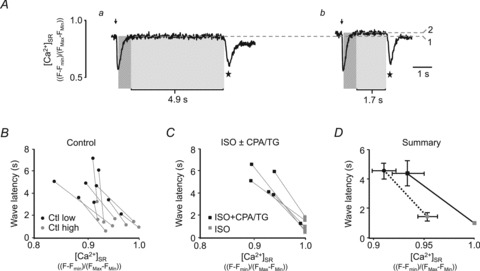
Figure 6. Wave latency is highly dependent on [Ca2+]SR.

A, representative fluo-5N fluorescence traces from a cell with [Ca2+]SR at the wave threshold (a, threshold marked with dashed line 1) and above the wave threshold (b, steady-state [Ca2+]SR before wave marked with dashed line 2). In each trace, arrow denotes AP stimulation triggering [Ca2+]SR depletion, followed by SR Ca2+ refilling (dark grey) and a wave latency time (light grey) prior to the Ca2+ wave (marked by star). B, individual paired experiments obtained from nine cells, each yielding a wave latency measurement at two different [Ca2+]SR levels under control conditions (Ctl low, Ctl high). C, individual paired experiments obtained from six cells, each yielding a wave latency measurement in the presence of ISO (grey square) alone and in the combined presence of ISO plus CPA or TG (ISO+CPA/TG black square). D, summary data (averages from data shown in B and C) of the relationship between [Ca2+]SR and Ca2+ wave latency under control conditions at two different [Ca2+]SR levels (circles), in ISO (grey square) and in ISO+CPA/TG (black square). Statistical significance analysis of these data is presented in the text.
