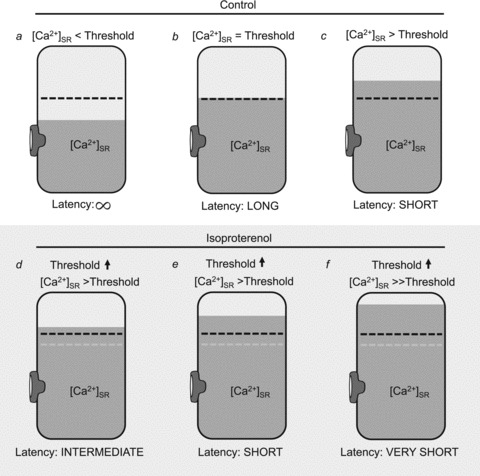
Figure 7. Schematic diagram of proposed relationship between SR Ca2+ content, Ca2+ wave threshold and latency.

Schematic diagram of the SR showing the relationship between [Ca2+]SR (shaded area), the Ca2+ wave threshold (dashed black line) and Ca2+ wave latency when [Ca2+]SR is below (a), at (b) and above (c) the Ca2+ wave threshold. In the presence of ISO (d, e and f) the Ca2+ wave threshold (dashed black line) is increased when compared with control conditions (dashed grey line). When [Ca2+]SR is similar between control condition (c) and ISO condition (d), latency is shorter in control due to [Ca2+]SR being higher above the respective wave threshold. When [Ca2+]SR is elevated by the same relative amount above the wave threshold under control conditions (c) and with ISO (e) wave latencies are similar even though the total [Ca2+]SR is higher with ISO. Under most experimental conditions [Ca2+]SR increases dramatically in the presence of ISO, thus elevating [Ca2+]SR well above the respective Ca2+ wave threshold, resulting in a very short wave latency (f).
