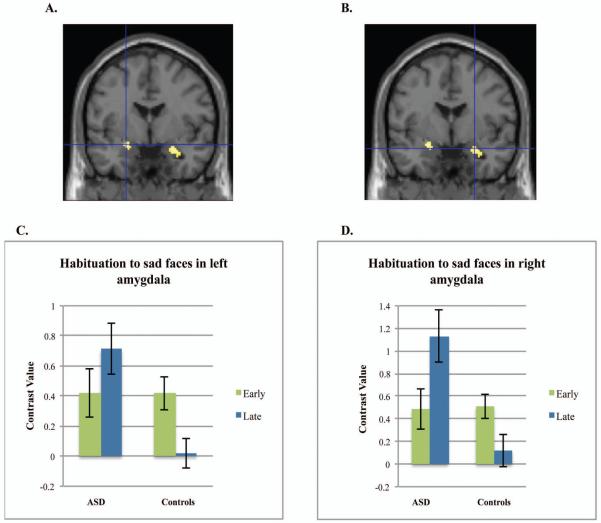
Figure 1.
Amygdala habituation to sad faces. Note: Controls demonstrate greater habituation to sad faces in left amygdala (A) and right amygdala (B) compared to the group with autism spectrum disorders (ASD). Figure shows the group difference of Controls>ASD for the contrast of sad early faces>sad late faces. Graphs represent the mean contrast values for early and late sad faces extracted from the left (C) or right amygdala (D) structural regions of interest. Error bars represent 1 S.E. All figures are thresholded at p<.001 uncorrected.

