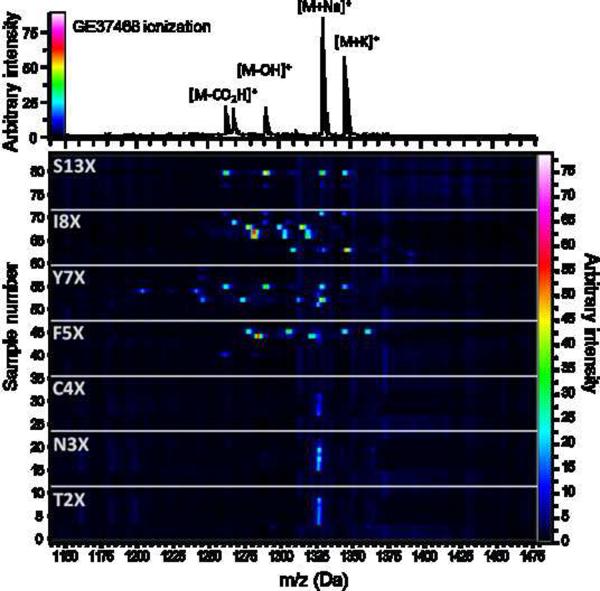
Figure 3.
MALDI-TOF heat map. MALDI-TOF mass spectrometry performed on individual library colonies produced a four mass fingerprint for expressing variants (top). Spectra were converted into a “heat map” (bottom) by correlating peak intensity with color. For clarity, 12 randomly chosen samples are shown to illustrate permissibility for mutation at each residue (X = any amino acid). The full data set of 476 samples is presented in Figure S3b. The mass at approximately 1325 Da in the heat map is an unrelated S. coelicolor metabolite.

