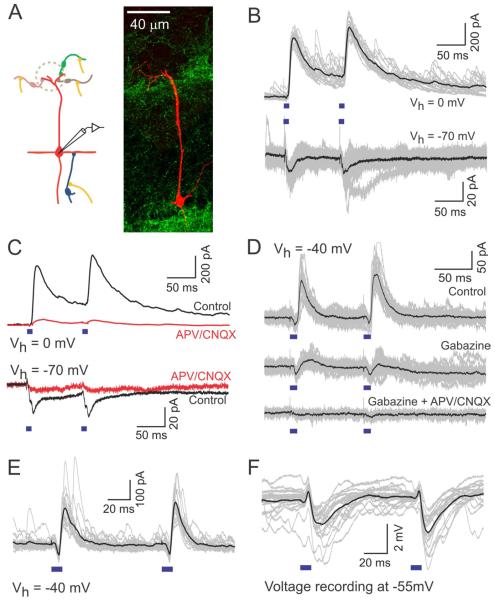
Figure 2. Light-stimulation of AON axon terminals in slice evokes excitatory and inhibitory synaptic currents in MCs.
(A) A schematic illustrating the circuit (left) and a confocal image of a reconstructed MC filled with biocytin during recording (right). (B) Light-evoked IPSCs (top) and EPSCs (bottom) recorded in different MCs at 0 and −70 mV, respectively. Black trace is the average of the individual traces shown in gray here and in the following figures. (C) Both IPSCs (top) and EPSCs (bottom) are blocked by the application of glutamatergic blockers (APV 100 μM, CNQX 10 μM). (D) Gabazine (10 μM) blocks light evoked IPSCs without affecting EPSCs. Inhibitory responses also disappear upon application of glutamatergic blockers. (E-F) Light-evoked PSCs (E) and PSPs (F) recorded in a MC in voltage (Vh = −40 mV) and current clamp (resting potential, Vm ~ −55 mV) modes, respectively. Both modes reveal both the excitatory and the inhibitory components. In MC recordings here and in other cell types below, synaptic responses to paired stimuli did not show a consistent trend for facilitation or depression.

