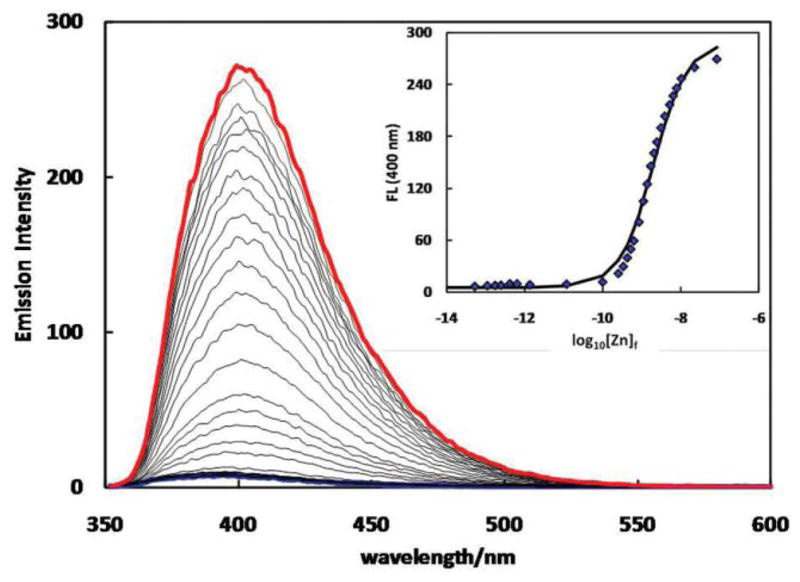
Fig. 10.

Emission spectra of 2a (6.4 μM, λex = 340 nm) in 10% DMSO-containing aqueous solution (HEPES: 50 mM, pH = 7.4, HEDTA: 2.5 mM, EGTA: 2.5 mM, NTA: 5 mM, KNO3: 100 mM) upon addition of Zn(ClO4 )2 (0–8.8 mM). The spectra that were collected at the beginning and the end of a titration experiment are coded blue and red, respectively. Inset: fluorescence intensity at 400 nm vs. log10 [Zn]f ([Zn]f – free zinc ion concentration, calculated using “Webmaxc Standard”6,29).
