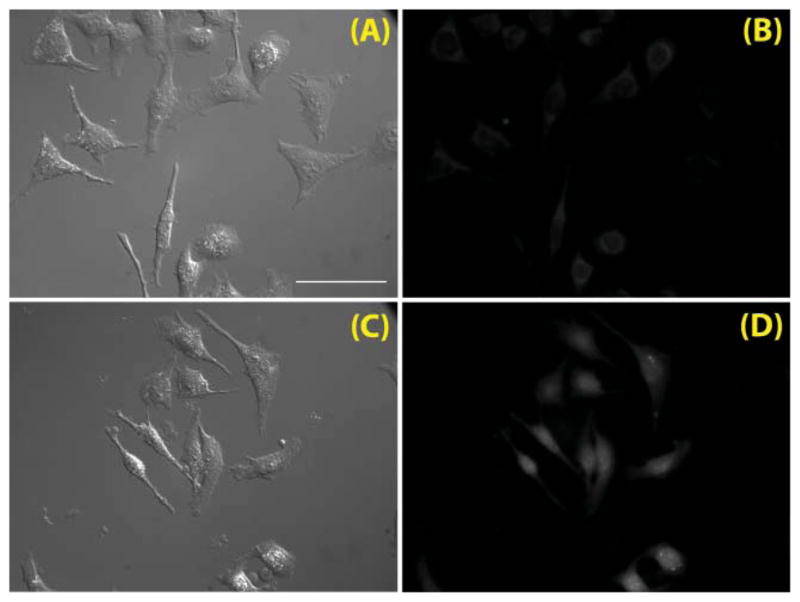
Fig. 11.

(A) Differential interference contrast (DIC) and (B) fluorescence images (Omega Q-Max Blue filter set; excitation 355–405 nm; emission 420–480 nm) of live HeLa cells loaded with 2a (incubation time 30 min, loading concentration 9.5 μM) in HBSS buffer at 37 °C under 5% CO2. (C) DIC and (D) fluorescence images of live HeLa cells treated under the same conditions in the presence of 100 μM ZnCl2. Scale bar – 50 μm.
