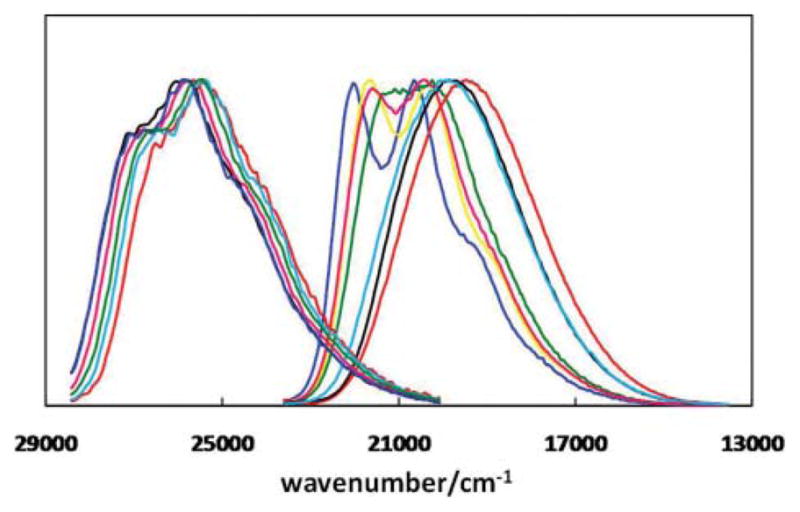
Fig. 5.

Normalized emission spectra of 3 (clustered on the left) and 4 (right) in various solvents. For the spectra of 4, the colour coding from left to right is the following: blue – cyclohexane (ε = 2.0), yellow – benzene (ε = 2.3), pink – dioxane (ε = 2.2), green – chloroform (ε = 4.8), cyan – DMSO (ε = 46.4), black – acetonitrile (ε = 35.9), and red – methanol (ε = 32.7). ε: relative permittivity.20
