Figure 2.

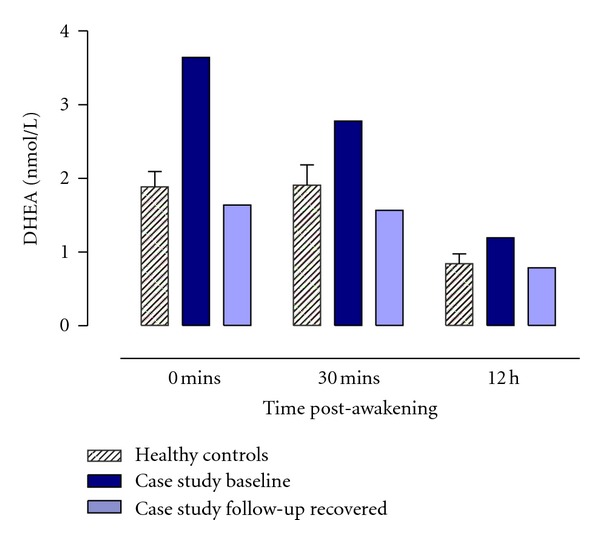
Mean (±SEM) salivary DHEA concentrations (nmol/l) after awakening and over the daytime period for the healthy control group (n = 15) and case study Bella at baseline and when recovered at one year follow-up.

Mean (±SEM) salivary DHEA concentrations (nmol/l) after awakening and over the daytime period for the healthy control group (n = 15) and case study Bella at baseline and when recovered at one year follow-up.