
Figure 3.
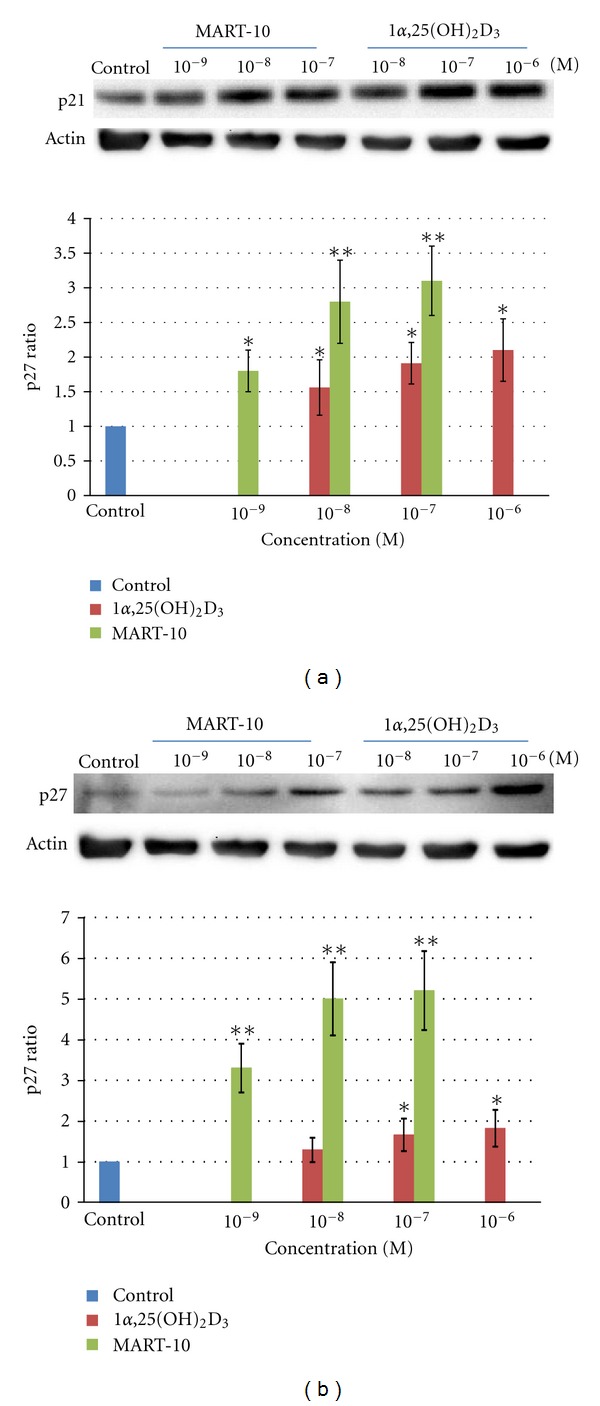
Western blot analysis for the expressions of p21 and p27 after treating MCF-7 cells with 1α25(OH)2D3 and MART-10. (a) A western blot (30 μg protein was loaded for each individual lane) depicting a typical dose-dependent upregulation of p21 protein expression in response to the treatment with 1α25(OH)2D3 or MART-10 for 2 days (upper panel). Actin was used as the loading control. The lower panel shows the average radio of the dose-dependent p21 expression relative to actin expression from three independent experiments. Each value is a mean ± SD of three independent determinations. (b) A western blot (30 μg protein was loaded for each individual lane) depicting a typical dose-dependent up-regulation of p27 protein expression in response to the treatment with 1α25(OH)2D3 or MART-10 for 2 days (upper panel). Actin was used as the loading control. The lower panel depicts the average radio of the dose-dependent p27 expression relative to actin expression from three independent experiments. Each value is a mean ± SD of three independent determinations. *P < 0.05, **P < 0.001 versus control.