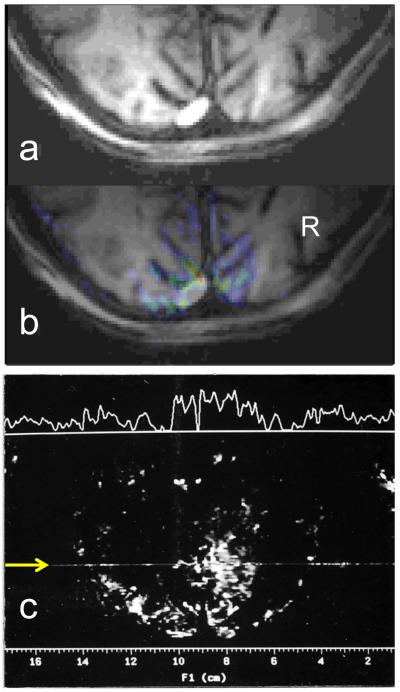
Figure 1.
(a) and (b) are the images that were published as Figure 2 in the Ogawa et. al. 1992 paper; panel (b) shows the full-field visual stimulation functional image (in color) superimposed on the anatomical image in gray scale; the latter is presented also separately in panel (a). Panel (c) illustrates a functional image of hemifield visual stimulation (on minus off) from 1991, obtained with 4 mm slice and in plane resolution 1.4×1.4 mm2. The signal intensity trace along the line marked with the yellow arrow appears on top of the image

