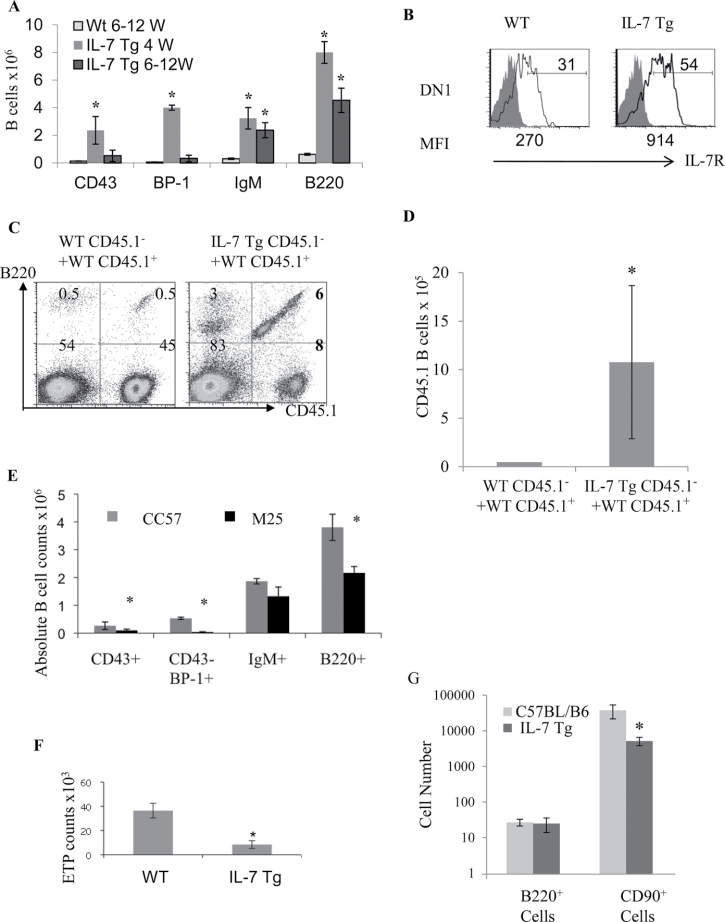
Fig. 1.
Analysis of αβ thymocytes and B cells in the thymi of IL-7 Tg mice. (A) Absolute counts of pro-B (CD43+), pre-B and late pro-B (BP-1+), immature/mature B cells (IgM+) and total B220+ in the thymus of 4-week- (black bars) or 6- to 12-week- (grey bars) old IL-7 Tg mice and 6- to 12-week- (outlined bar) old WT mice are shown as mean ± standard error (10 mice in each group, *P < 0.0001). (B) IL-7R expression on thymocytes comprising the DN1 population (Lin−CD44+CD25−c-Kit+) in IL-7 Tg and WT mice (open histograms) compared with the isotype control (filled histograms), the mean fluorescence intensity (MFI) is shown below the histograms. The full gating for the FACS is shown in Supplemental Figure 1B, available at International Immunology Online. Data are representative of five experiments with three mice for each group. (C) Analysis of thymic B cells in mixed BM chimeras. The plots show thymic B220+ cells derived from CD45.1+ and CD45.1− BM cells in both recipients. (D) Average numbers of thymic CD45.1+ B cells obtained when CD45.1+ WT BM were co-injected with IL-7 Tg or WT CD45.1− cells. n = 7 mice in each group (*P value of 0.022). (E) Absolute number of thymic B cells in IL-7 Tg mice that received neutralizing anti-IL-7 mAb M25 (black bars) versus control CC57 (grey bars) are shown. (*P values of 0.03, 0.005 and 0.008 for total B220+, pro-B (CD43+) and pre-B (CD43−BP-1+) in the M25-treated IL-7 Tg mice, respectively). Each group included four mice. (F) ETPs in the thymus of 4-week-old IL-7 Tg and WT mice (*P = 0.0019; n = 9–13 mice). (G) Average numbers of B220+ or CD90+ cells obtained from co-cultures of ETPs sorted from either WT or IL-7 Tg mice and OP9-DL1 cells are shown from quadruplicate wells (P < 0.001).

