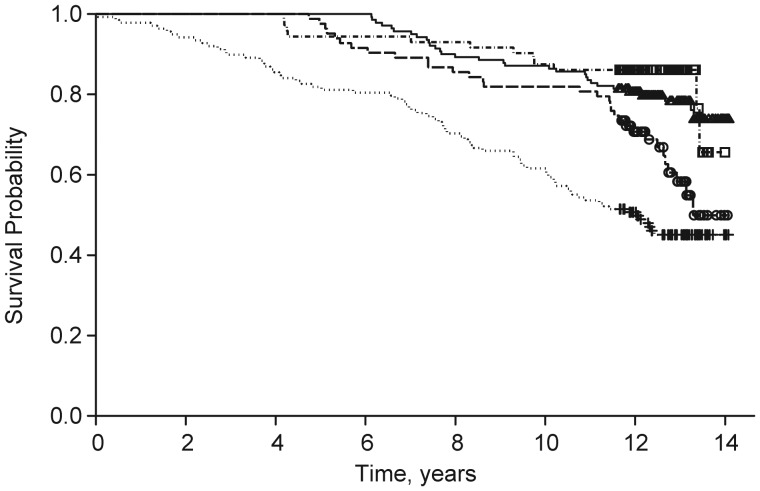
Figure 4.
Kaplan-Meier survival curve by physical activity trajectory classes in the Women's Health and Aging Study II, 1994–2009. Shown are curves for the always active (dot-dashed line, squares), fast declining (dashed line, circles), stable moderate (solid line, triangles), and always sedentary (dotted line, cross) groups, with the squares, circles, triangles, and crosses representing censoring time within each of the 4 classes, respectively.

