
Figure 1.
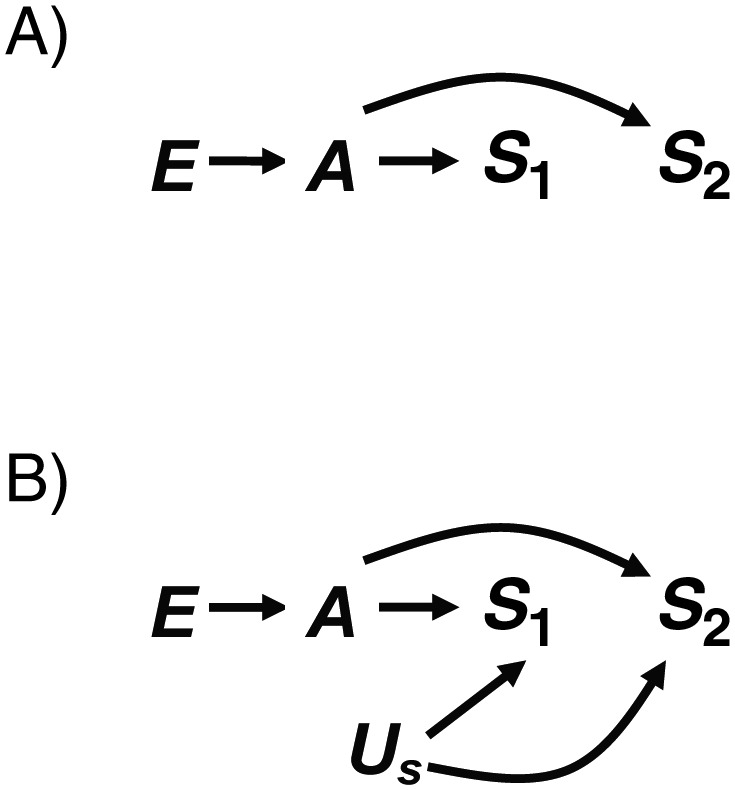
A) Directed acyclic graph (DAG) 1A, in which a single exposure (E) causes a single underlying abnormality (A) that causes both outcomes (S1 and S2). B) DAG 1B, in which a shared cause (Us) of S1 and S2 is added to DAG 1A.
Official websites use .gov
A
.gov website belongs to an official
government organization in the United States.
Secure .gov websites use HTTPS
A lock (
) or https:// means you've safely
connected to the .gov website. Share sensitive
information only on official, secure websites.
A) Directed acyclic graph (DAG) 1A, in which a single exposure (E) causes a single underlying abnormality (A) that causes both outcomes (S1 and S2). B) DAG 1B, in which a shared cause (Us) of S1 and S2 is added to DAG 1A.