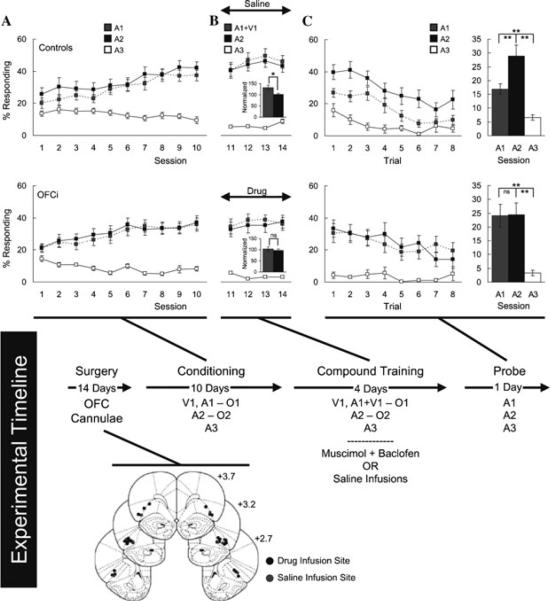
Figure 1.
OFC contribution to Pavlovian overexpectation, adapted from Takahashi et al.58 Shown is the experimental timeline linking conditioning, compound conditioning, and probe phases to data from each phase. Top and bottom rows of plots indicate control (saline infusion into the OFC) and OFCi group (muscimol + baclofen infusion into the OFC), respectively. In timeline and plots, V1 is a visual cue (a cue light); A1, A2, and A3 are auditory cues (tone, white noise, and clicker, counterbalanced), and O1 and O2 are different flavored sucrose pellets (banana and grape, counterbalanced). Position of the cannula within OFC in saline controls (gray dot) and OFCi (black dot) rats are shown beneath the timeline. (A) Percentage of individuals responding to food cup during cue presentation across 10 days of conditioning. Gray, black, and white squares indicate A1, A2, and A3 cues, respectively. (B) Percentage of those responding to food cup during cue presentation across four days of compound training. Gray, black, and white squares indicate A1/V1, A2, and A3 cues, respectively. Gray and black bars in the insets indicate average normalized percentage responding to A1/V1 and A2, respectively. (C) Percentage of those responding to food cup during cue presentation in the probe test. Line graph shows those responding across the eight trials, and the bar graph shows average number responding in these eight trials. Gray, black, and white colors indicate A1, A2, and A3 cues, respectively. * P < 0.05 and ** P < 0.01 on post hoc contrast testing. NS, not significant. Error bars denote SEM.

