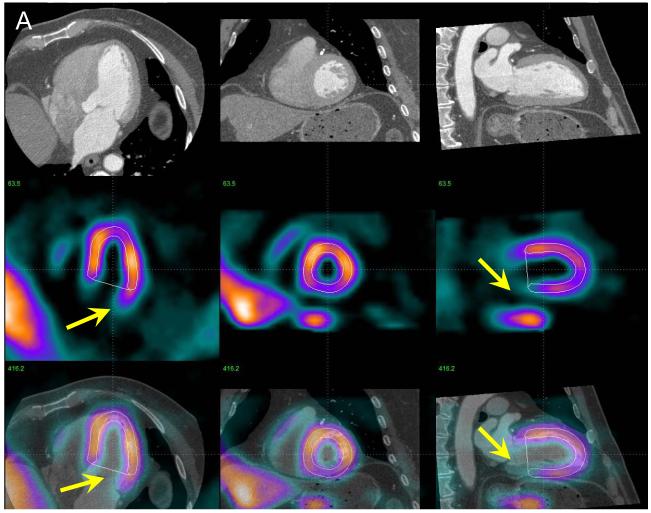
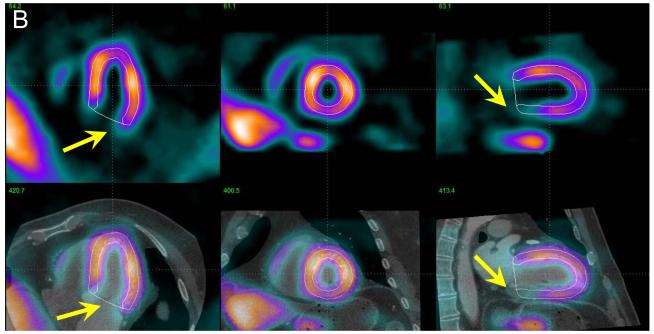
Figure 4.
Example of MPS contour adjustment after MPS-CTA coregistration. In panel A, co-registered CTA and MPS images are shown in the same configuration as in Figure 2 with MPS contours overlaid (white lines). Image fusion reveals that the valve plane is determined incorrectly (yellow arrows). The same images are shown after MPS contour adjustment (B), revealing RCA defect on MPS. ICA confirmed a ≥ 70% stenosis in the RCA.


