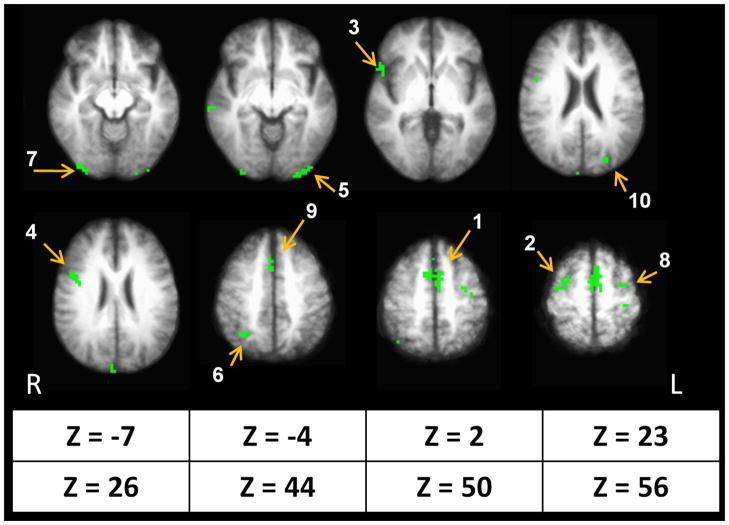
Figure 5.
Commodity type disjunction mask indicating regions of significant differences in activity compared to rest (p <.005, minimum cluster size = 5 voxels). The ten largest regions of interest (ROIs) are illustrated with numbers in descending order of magnitude; the numbers correspond to the ROIs in Table 4, where neuroanatomical labels and specific coordinates are provided.

