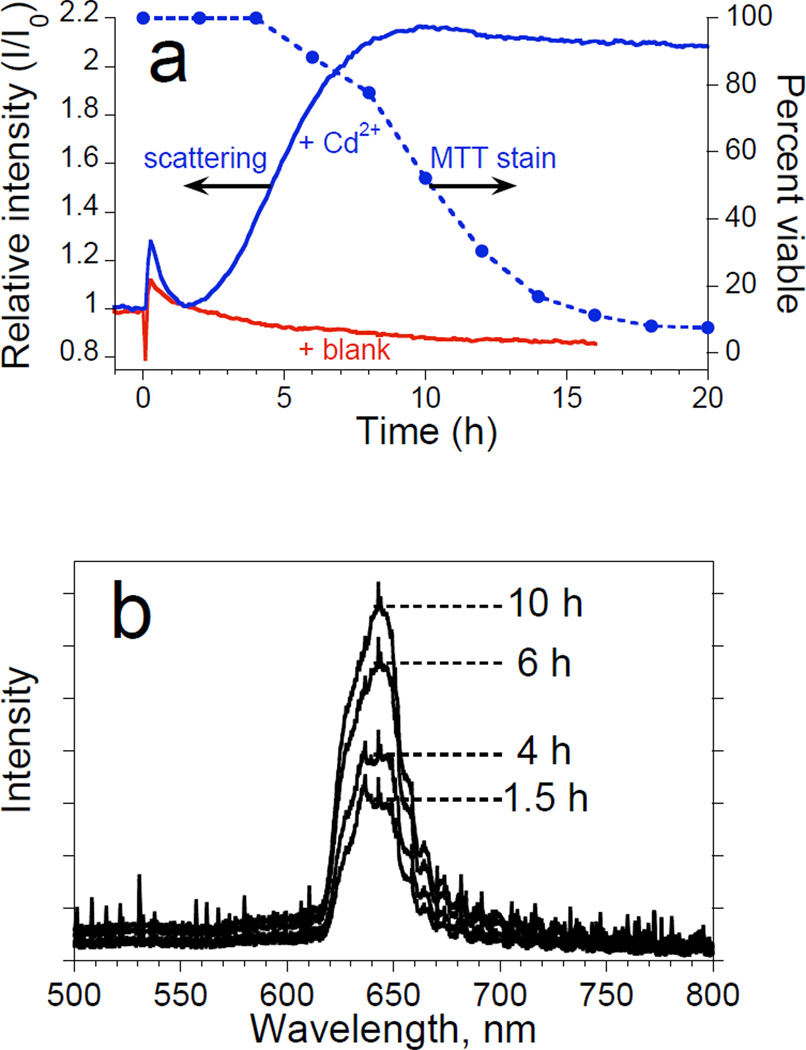
Figure 4.
Observation of morphology changes of a monolayer of primary rat hepatocyte cells by monitoring the intensity of light scattered from a porous Si photonic crystal substrate. Cells are monitored after exposure to a toxic dose of Cd2+ and are obtained using the optical setup shown in Figures 1c and 1d. Experiments are performed on cells maintained in an incubator. (a) Plots of intensity of scattered light (left axis) from a porous Si photonic crystal and percent viability from MTT stain (right axis) as a function of time after introduction of 50 µM Cd2+ to primary rat hepatocytes. The quantity I/I0 is defined as the ratio of the value of the integrated intensity of the scattered spectral peak to its value at t = 0 (time point immediately before injection of the toxin or blank). Solid trace marked “+Cd2+” represents the change in relative scattering intensity after the solution is adjusted to 50 µM Cd2+ at t = 0. Solid trace marked “blank” represents a control experiment in which relative scattering intensity is monitored after an equivalent volume of culture media is added to the cells instead of Cd2+. Solid circles (dashed line) represent the results of the corresponding viability assay (MTT stain) for hepatocytes exposed to 50 µM Cd2+ on tissue culture polystyrene. (b) Representative spectra used to obtain the “scattering” trace in (a). The peak maximum occurs at ~650 nm.

