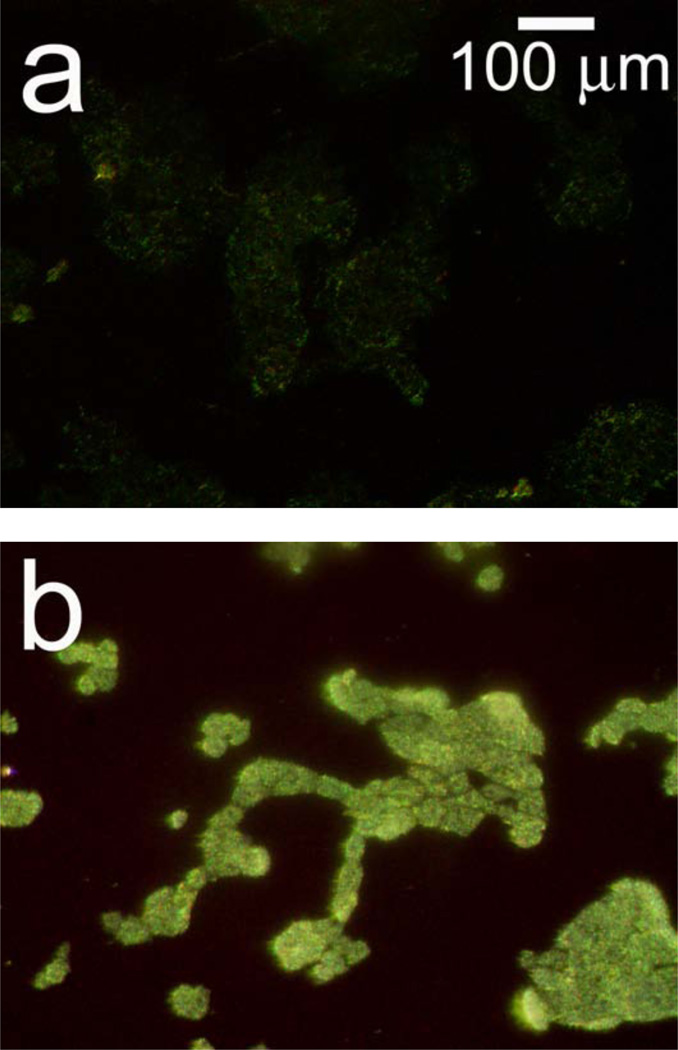
Figure 7.
Microscope images monitoring APAP-induced morphology changes of hepatocytes on a photonic crystal. Data were collected using the optical design illustrated in Figures 1c and d. Cells were seeded on a chip that was etched to reflect in the green region of the spectrum to demonstrate potential multiplexing applications. Images collected (a) before and (b) 20 h after addition of 40 mM APAP. Hepatocytes were incubated for this experiment, and therefore different regions are observed for (a) and (b) since the cells were removed from the incubator prior to image acquisition.

