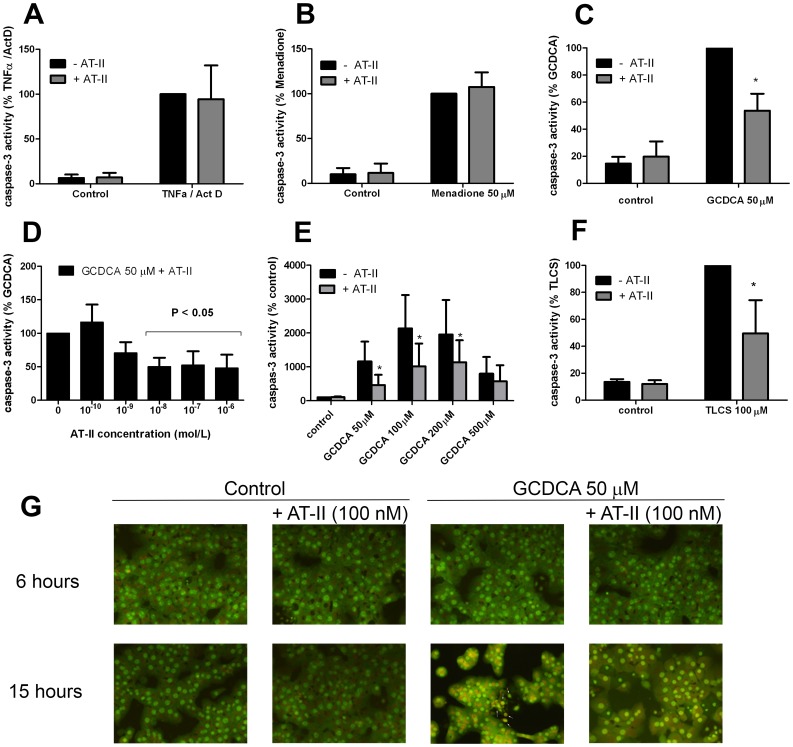
Figure 1. Angiotensin II (AT-II) inhibits glycochenodeoxycholic acid (GCDCA)-induced apoptosis but not TNFα- and menadione-induced apoptosis.
(a) Caspase-3 activity in rat hepatocytes treated with 20 ng/ml of TNFα and 200 ng/ml of transcriptional inhibitor actinomycin-D for 16 hours in the presence and absence of 100 nmol/L AT- II. (b) Caspase-3 activity in rat hepatocytes treated with 50 µmol/L of menadione for 9 hours in the presence and absence of 100 nmol/L AT-II. (c) Primary rat hepatocytes were treated for 4 hours with 50 µmol/L of GCDCA, 100 nmol/L of AT-II or a combination of both. AT-II was added 10 min prior to the addition of GCDCA. Two-way ANOVA test was used to determine the significance of differences between experimental groups (N = 5). * P<0.05 for GCDCA +AT-II vs. GCDCA alone. (d) Hepatocytes were treated with different concentrations of AT-II 10 min prior to the addition of 50 µmol/L of GCDCA for 4 hours. One-way ANOVA test was used to determine the significance of differences between experimental groups (N = 5). (e) AT-II (100 nmol/L) significantly inhibits GCDCA-induced caspase-3 activation. Two-way ANOVA test was used to determine the significance of differences between experimental groups (N = 5). * P<0.05 for GCDCA (50, 100, 200 µM)+AT-II vs GCDCA (50, 100, 200 µM) alone. (f) AT-II inhibits tauro-lithocholic acid-3 sulfate (TLCS)-induced caspase-3 activity. Hepatocytes were treated for 6 hours with 100 µmol/L of TLCS, 100 nmol/L of AT-II or a combination of both. Cells were treated with AT-II 10 min prior to the addition of TLCS. Two-way ANOVA test was used to determine the significance of differences between experimental groups (N = 5).* P<0.05 for TLCS +AT-II vs. TLCS alone.(g) Acridine orange staining. Treatment with 50 µmol/L of GCDCA induces nuclear condensation and fragmentation (white arrows) which is blocked with 100 nmol/L AT-II at 15 hours-time point.

