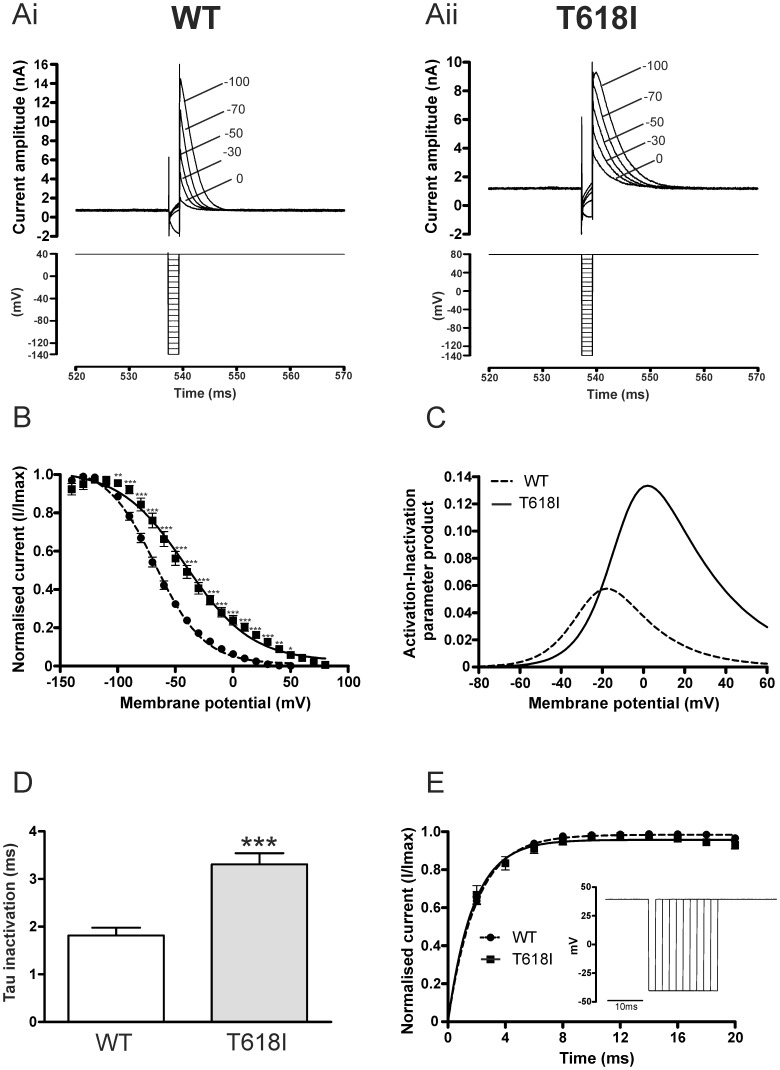
Figure 3. Voltage dependence of WT and T618I IhERG inactivation.
(Ai, Aii) Upper traces show representative current records for WT IhERG (Ai) and T618I IhERG (Aii) elicited by voltage protocols shown in lower panels (see also ‘Results’ text). A more positive voltage (+80 mV) was used for the first and third steps for T618I hERG than for WT hERG (+40 mV) to ensure that complete inactivation occurred on membrane potential depolarisation. Note that for clarity of display only selected traces elicited by the protocol are shown. Numbers in Ai and Aii indicate command voltage at which currents recorded. (B) Plots against voltage (during the second step of the protocol) of IhERG availability. Peak current values and availability plots were constructed as described previously [16], employing deactivation correction as per [31]. A Boltzmann equation fit to the data gave a V0.5 for inactivation of −67.2 mV (k = 21.0 mV) for WT and a V0.5 of −44.3 mV (k = 29.8) for T618I (n = 11 and 6 cells respectively). (C) ‘Window current’ for WT and T618I hERG. Derived activation and inactivation V0.5 and k values from Figures 1D and 3B were used with equations 1 and 2 to calculate activation and inactivation variables at 2 mV intervals between −80 and +60 mV. Window IhERG was calculated as the activation-inactivation variable product at each voltage. (D) Bar charts comparing time constant of WT (n = 11) and T618I (n = 6) IhERG inactivation, following brief hyperpolarisation to −140 mV. Inactivating currents were fitted with a standard mono-exponential function (E) Recovery from inactivation time-course for WT and T618I hERG (protocol shown as inset). The dashed gray line denotes mono-exponential fit to WT data (n = 7). The solid line denotes mono-exponential fit to T618I data, with the dotted line connecting these data at successive time points (n = 9). Asterisks in B and C denote statistical significance: *p<0.05; **p<0.01; ***p<0.001.

