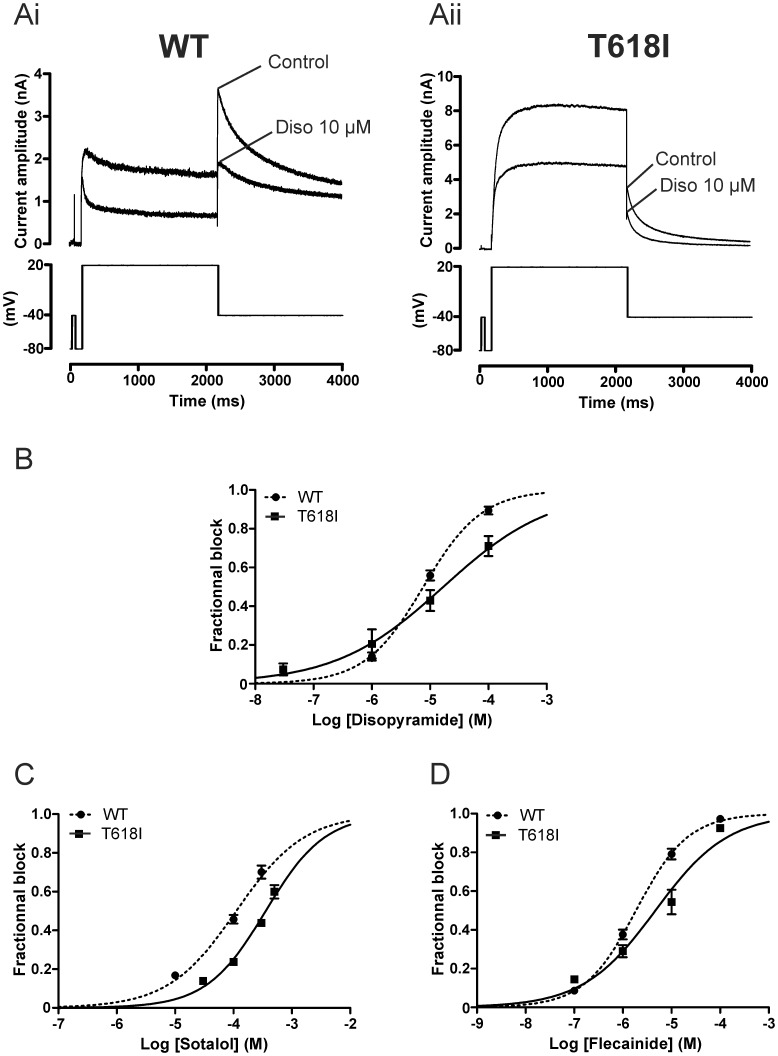
Figure 6. Effect of disopyramide, D-sotalol and flecainide on WT and T618I IhERG under conventional voltage clamp.
(A) Upper traces show IhERG elicited by voltage protocol shown in the lower panel in control solution and after exposure to 10 µM disopyramide (Diso). Ai shows data for WT IhERG, whilst Aii shows data for T618I IhERG. Note different current scales in Ai and Aii. (B) Concentration response relations for inhibition of WT and T618I IhERG by disopyramide. Fractional inhibition of IhERG was assessed for IhERG tails at each of 3 concentrations for WT IhERG (n = 5 cells at 1 µM; 13 at 10 µM and 5 at 100 µM; incorporating data from [26], with additional data from a further 8 experiments for 10 µM disopyramide) and 4 for T618I IhERG (n = 4 to 5 cells per concentration). (C) Concentration response relations for inhibition of WT and T618I IhERG by D-sotalol. Fractional inhibition of IhERG was assessed for IhERG tails at each of 3 sotalol concentrations for WT IhERG (n = 5 to 9 cells at each concentration) and 4 for T618I IhERG (n = 5 to 6 cells per concentration). (D) Concentration response relations for inhibition of WT and T618I IhERG by flecainide. Fractional inhibition of IhERG was assessed for IhERG tails at each of 4 flecainide concentrations for WT IhERG (n = 5 to 12 cells per concentration) and T618I IhERG (n = 5 to 6 cells per concentration).

