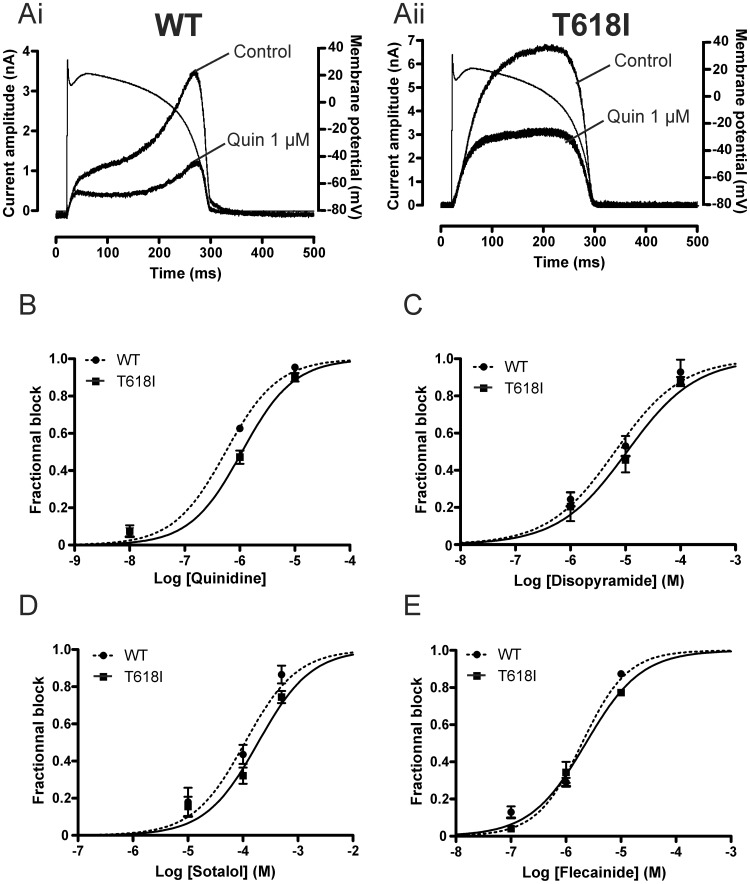
Figure 7. Pharmacology of WT and T618 IhERG under AP voltage clamp.
(A) Shows representative traces (after p/4 subtraction) of WT (Ai) and T618I (Aii) IhERG elicited by AP voltage clamp protocol (overlain) in control solution and after exposure to 1 µM quinidine. Note different current scales in Ai and Aii. AP commands were applied at 1 Hz. (B–D) Concentration response relations for inhibition of WT and T618I peak repolarising current observed during AP clamp by quinidine (B; 3 concentrations tested, n = 4 to 5 cells per concentration); disopyramide (C; 3 concentrations tested, n = 4 to 5 cells per concentration); D-sotalol (D; 3 concentrations tested, n = 4 to 5 cells per concentration); flecainide (E; 3 concentrations tested, n = 4 to 5 cells per concentration).

