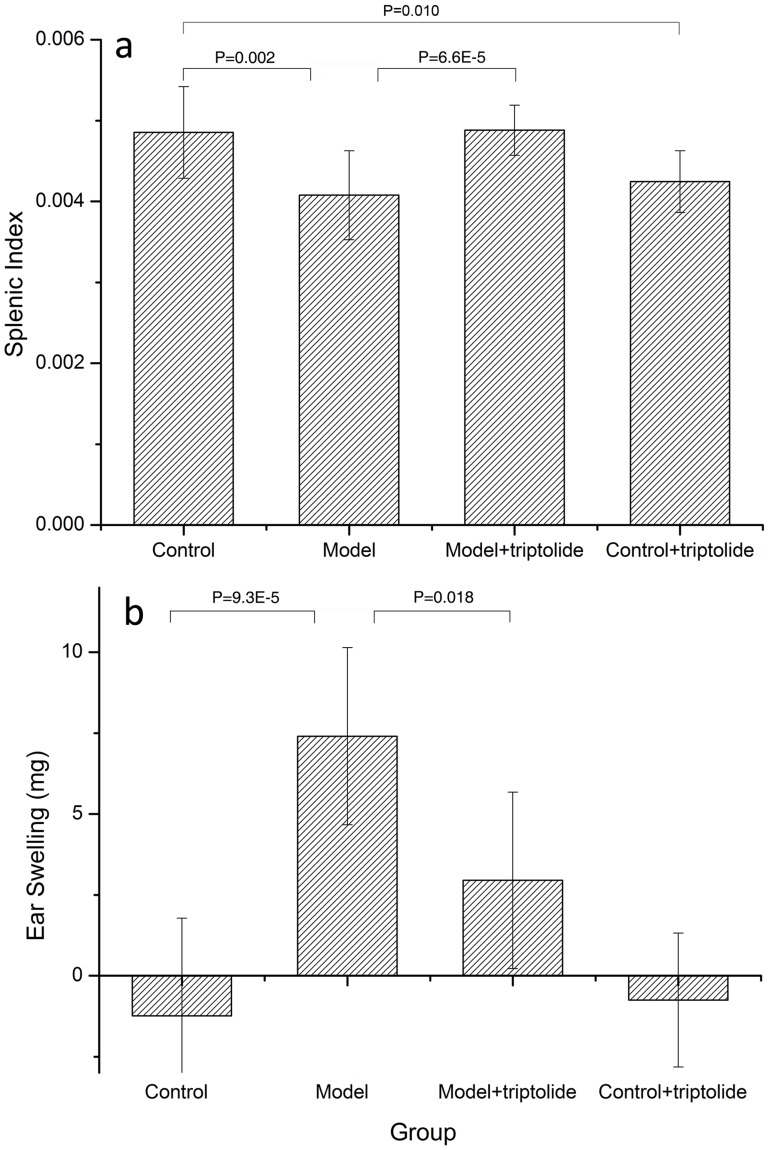
Figure 2. DTH model validation.
a) The splenic index of each group. The splenic index is expressed as the ratio of the weight of the spleen weight to the weight of the mouse. The four groups include: control, DTH model, DTH model+triptolide and control+triptolide, each of which contains eight samples. Statistical differences detected between the control & DTH model groups and the DTH model & DTH model+triptolide groups are indicated by the P-value between each group. b) Ear swelling in each group. Ear swelling was expressed as the difference between the weight of left and right ear patches obtained from 8 mm punches 30 h after challenge. The punches were obtained in a blinded manner. Data are expressed as the mean ± SD, and the values for each sample are the mean of eight separate samples.

