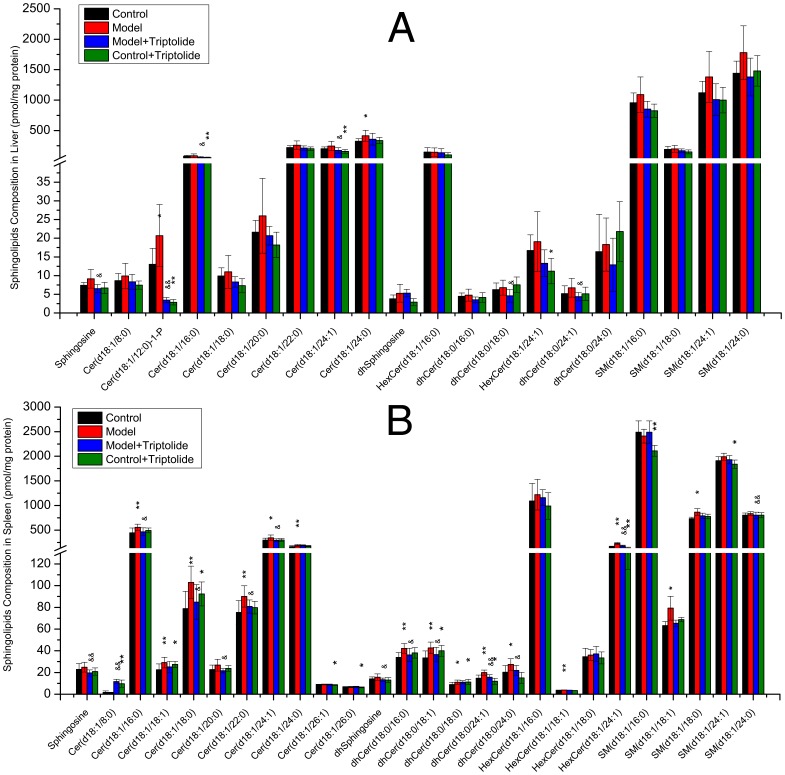
Figure 3. Sphingolipid composition of mice liver or spleen measured by triple quadruples MS/MS.
Four groups including: control, model, model+triptolide and control+triptolide, each of which contains 8 samples. Sphingolipids were isolated from liver or spleen homogenate corresponding to 1 mg protein. Bars are expressed as means ± SD, values for each tissue sample are the average of 8 samples separately (pmol/mg protein). Statistical difference from control or model group is indicated with an asterisk or a “&”, respectively. * or &: p<0.05 and ** or &&: p<0.01.

