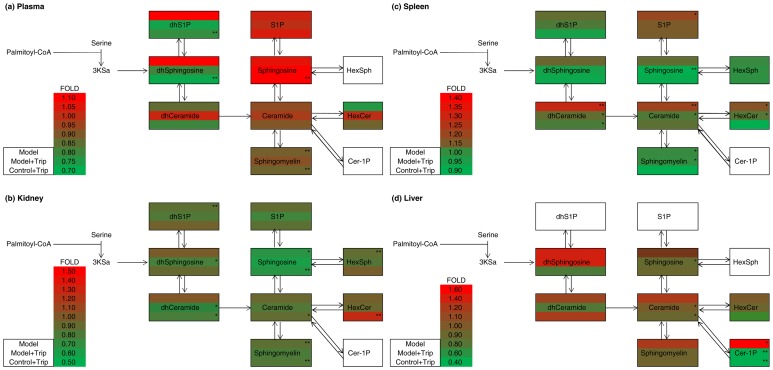
Figure 4. Visualization of sphingolipid metabolites in the plasma, kidney, spleen and liver.
The figure depicts sphingolipid metabolites that participate in the early steps of sphingolipid biosynthesis. The pathway maps are overlaid by the fold changes in subclasses of sphingolipid metabolites between the control group and other groups by asterisks indicating the statistical significance on the right side (* = P<0.05, ** = P<0.01; n = 8). The content of each sphingolipid metabolite was determined as the mean of eight independent parallel samples.

