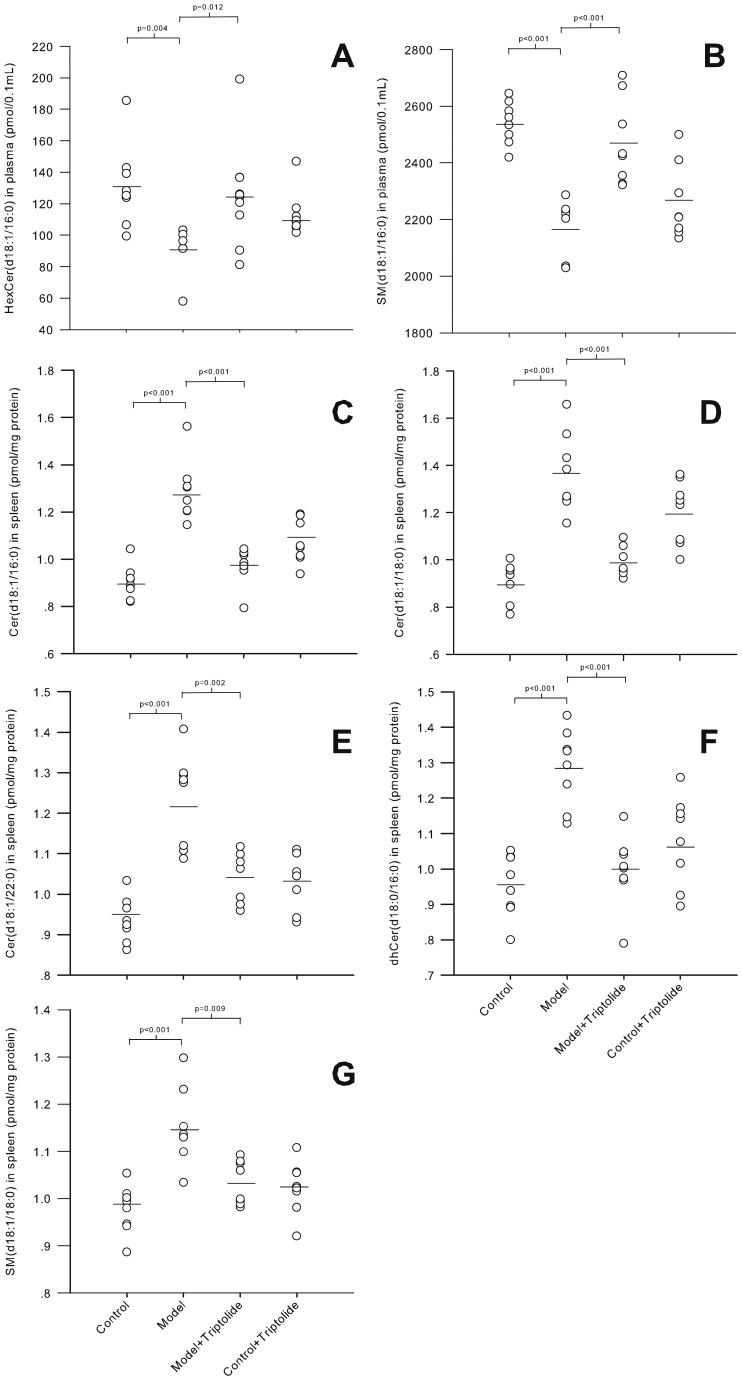
Figure 7. Sphingolipid biomarkers of DTH disease severity and response to triptolide treatment.
The levels of seven potential sphingolipid biomarkers in the plasma (A, B) and spleen (C-G) in control, DTH model, DTH model+triptolide and control+triptolide groups. The sphingolipids were identified based on data obtained by OPLS-DA with a significant correlation (p<0.05) to ear swelling and splenic index as indicators of DTH severity. Significant differences between the two groups were evaluated by Mann-Whitney U test with the P-value shown above each plot.

