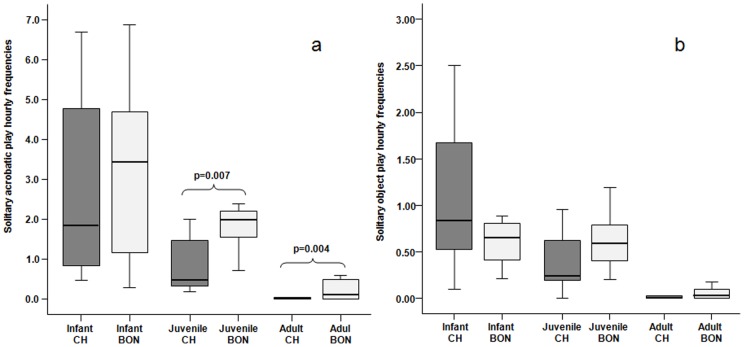
Figure 1. Distribution of solitary play.
Hourly frequency of solitary acrobatic play (a) and solitary object play (b) performed by infants, juveniles, and adults of the two Pan species. Solid horizontal lines indicate medians; length of the boxes corresponds to inter-quartile range; thin horizontal lines indicate range of observed values. Only the significant differences are reported.

