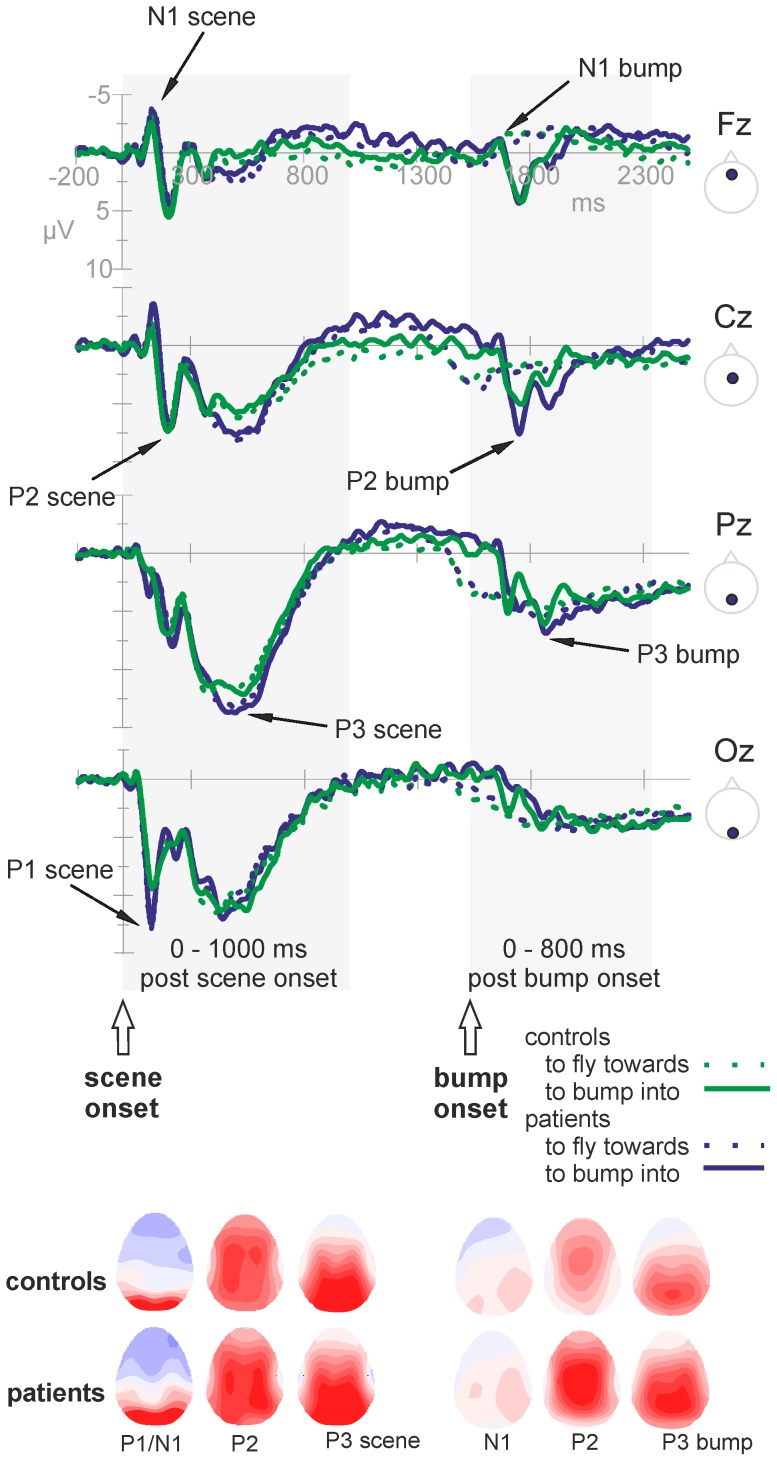
Figure 3. Overview of ERPs and topographies.
Top: Grand average ERPs of the patients with galactosemia (blue) and the healthy controls (green) across the midline of the scalp (F = Frontal, C = Central, P = Parietal, O = Occipital). The lines are averaged across conditions, but separate for the two action formats: solid lines represent the ‘to bump into’ format; dashed lines the ‘to fly towards’ format. The two epochs of interest are highlighted: the post scene onset epoch (where scenes of both action formats, and their corresponding ERPs, are still identical) and the post bump event epoch (where the analyses were limited to the ‘to bump into’ trials, as the ‘to fly towards’ trials do not show an ERP morphology during this time window). Negative voltage is plotted up in this and all subsequent figures. Bottom: Overview of the topographical distributions over the scalp of the components of interest, for each group seperately. Both the ERPs and the corresponding topographies illustrate an overall similar morphology for the patients and controls.

