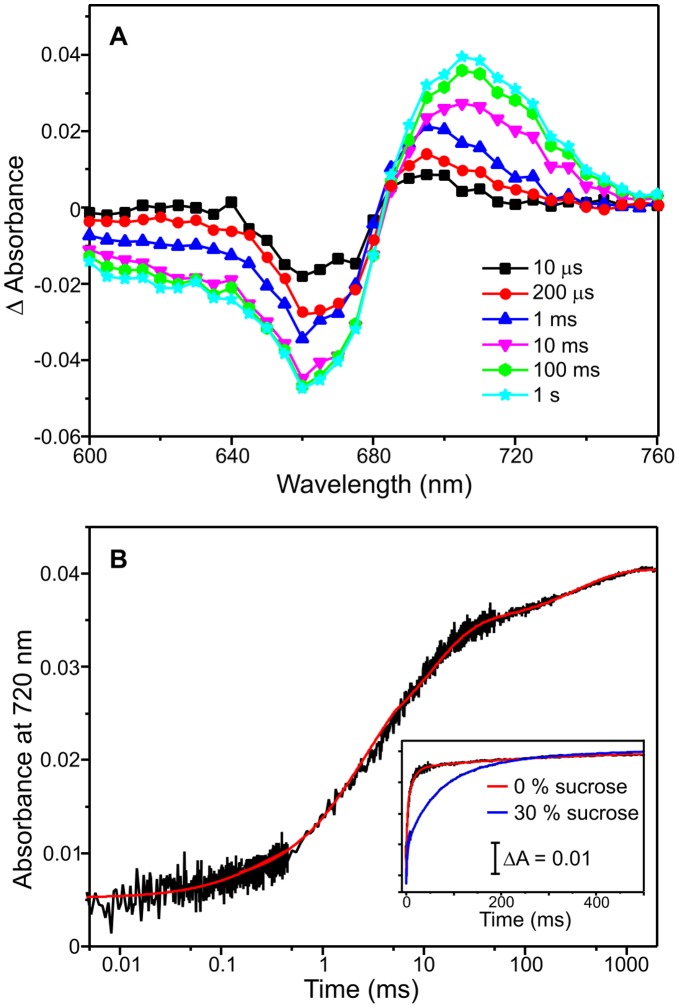
Figure 6. Characterization of the Pr → Pfr conversion by laser photoexcitaion measurements.
(A) Absorbance difference (‘action’) spectra following photoexcitation of 15 µM Cph1 (Pr form) with a 6 ns laser pulse at 660 nm. The spectra were created by measuring the absorbance change at the respective wavelength at various timepoints after laser excitation. (B) Typical kinetic traces measured at 720 nm over 1 second on a logarithmic timescale following photoexcitation of 15 µM Cph1 (Pr form) with a 6 ns laser pulse at 660 nm. The data were fitted to 4 kinetic phases to obtain rate constants (red line). The inset shows kinetic transients at 720 nm at 0% sucrose and 30% sucrose to illustrate the effect of solvent viscosity. All traces were collected at 20°C as described in the Materials and Methods section.

