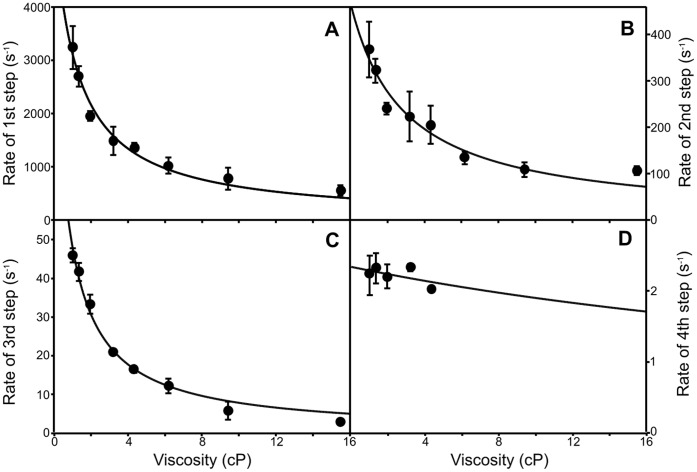
Figure 7. The viscosity-dependence of the slower steps in the Pr → Pfr photoconversion.
The viscosity dependence of the rate constant for the 1st (A), 2nd (B), 3rd (C) and 4th steps (D) of the increase in absorbance at 720 nm are shown. All measurements were recorded over a range of timescales and the data are fitted to equation 2 as described in the Materials and Methods. The error bars were calculated from the average of at least 3 traces.

