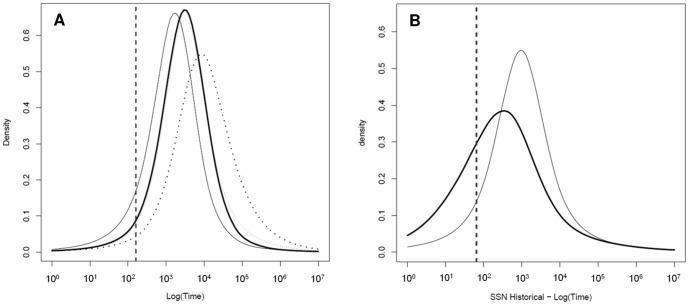
Figure 5. MSVAR results: time of population decline.
Posterior distribution of time of decline (T) for the linear (thin line) and exponential (thick line) models. A) Time (in years before present) for the contemporary SSN (solid lines) and NW (dashed lines). B) Time for the historical SSN. The vertical dotted line shows the approximate time of the European settlement of California (∼1850) relative to the age of each of the samples.

