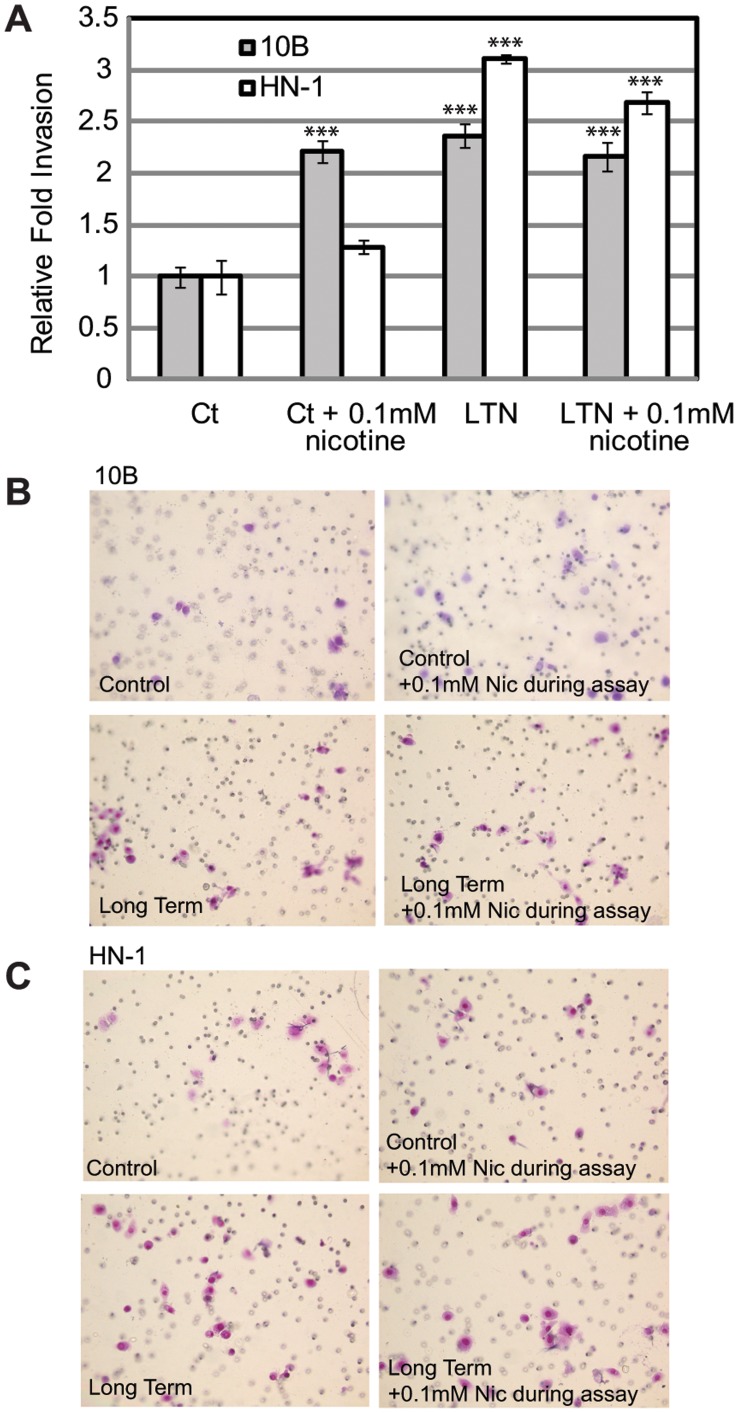
Figure 4. Long-term nicotine exposure increases invasiveness of 10B and HN-1.
A) Bar graph indicating the results of a matrigel invasion assay. B) Representative wells of invaded 10B cells. Permutations include control, control with addition of 0.1 mM nicotine during the invasion assay, cells treated long term in 0.1 mM nicotine without addition of nicotine during assay, cells treated long term in 0.1 mM nicotine with addition of 0.1 mM nicotine during assay. C) Representative wells of invaded HN-1 cells, with same permutations as above. *p<0.05, **p<0.01, ***p<0.001.

