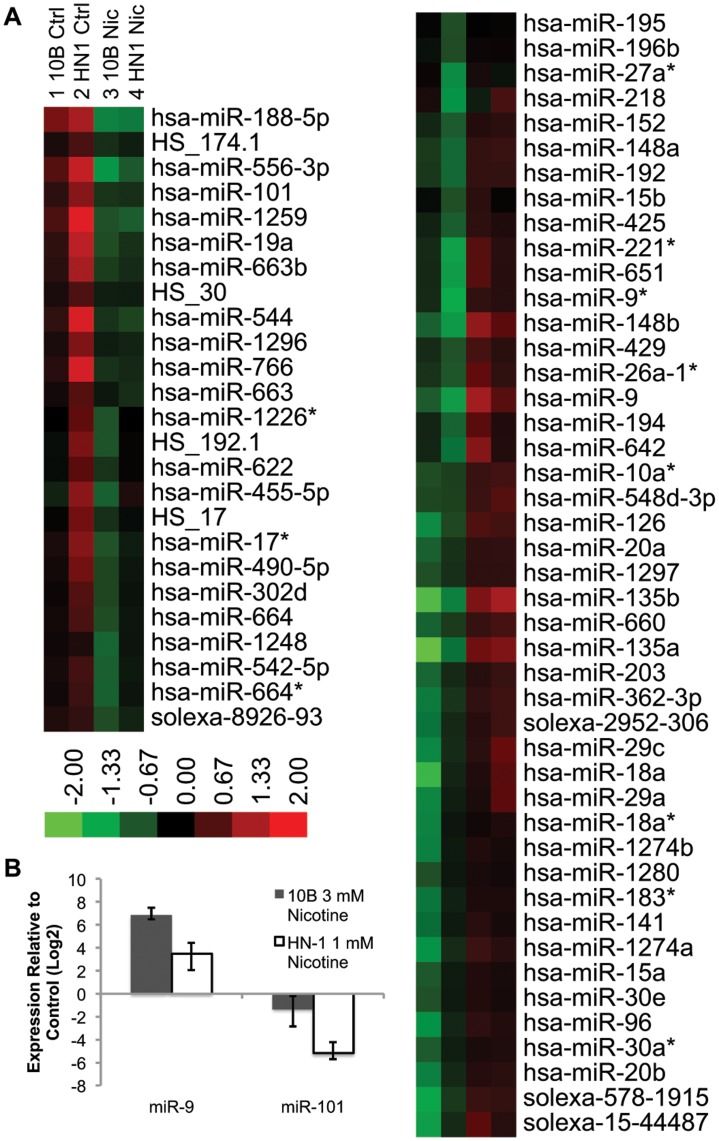
Figure 7. MicroRNA profile of nicotine-treated vs non-treated cells.
A) Log expression values are computed based on fold expression from the median value within each row. Genes were excluded based on the criteria of having at least 20% of expression values showing a 1.5 fold increase or decrease relative to the median. Downregulated genes that clustered with miR-101 and upregulated genes that clustered with miR-9 were magnified within the figure. B) qPCR validation of miR-9 and miR-101 expression.

