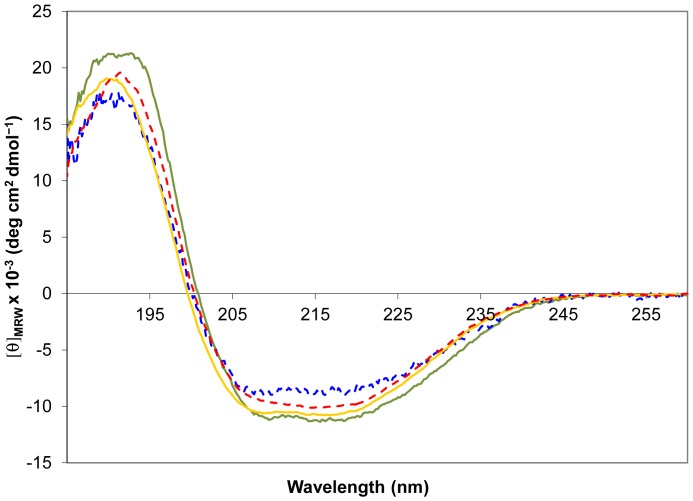
Figure 5. Far-UV CD spectra of CBG.
The spectra confirm folded protein before and after cleavage of the RCL. Cleaved samples have been incubated with neutrophil elastase prior to buffer exchange. Native rat CBG-WT (green line) and cleaved rat CBG-RCL1 (blue broken line) show a similar curve shape with slight difference in signal strength, which is most probably due to errors in concentration measurements. In the comparison of native human CBG (yellow line) and cleaved human CBG (red broken line) a slight change in curve shape in the area around 208 nm is visible.

