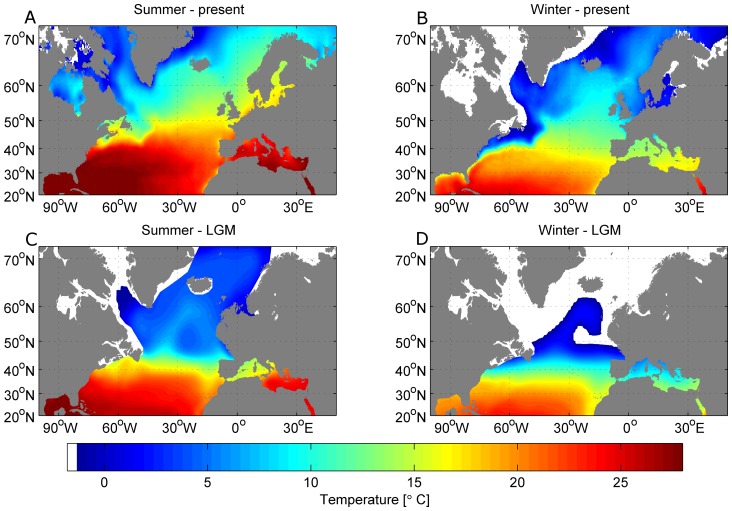
Figure 1. Environmental conditions today and during the LGM.
Top row: Sea Surface Temperature (SST) for February (A) and August (B) from the gridded SST dataset and corresponding sea ice extend (white) for today. Bottom row: SST during the LGM based on GLAMAP data for February (C) and August (D). Land is grey and is based on the 5-minute Terrainbase elevation data, lifted by 123 m for the LGM dataset. Ice sheet and sea ice extent are shaded white.

