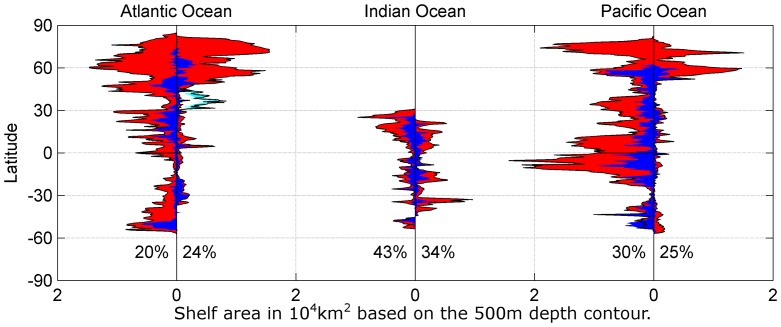
Figure 3. Shelf areas today and during the LGM.
Available continental shelf area (<500 m) during the LGM (blue) based on a sea level drop of 123 m and today (red) per degree latitude. The left panel shows the Atlantic Ocean. The western shelf areas are on the left side of the zero line, while the eastern shelf areas are on the right side, excluding the Mediterranean Sea, which is shown in black (today) and cyan (LGM). The middle panel shows the Indian Ocean and the Pacific Ocean is shown in the right panel in a similar fashion. The percentile area during the LGM when compared to today for each western and eastern side of the ocean basins are shown.

