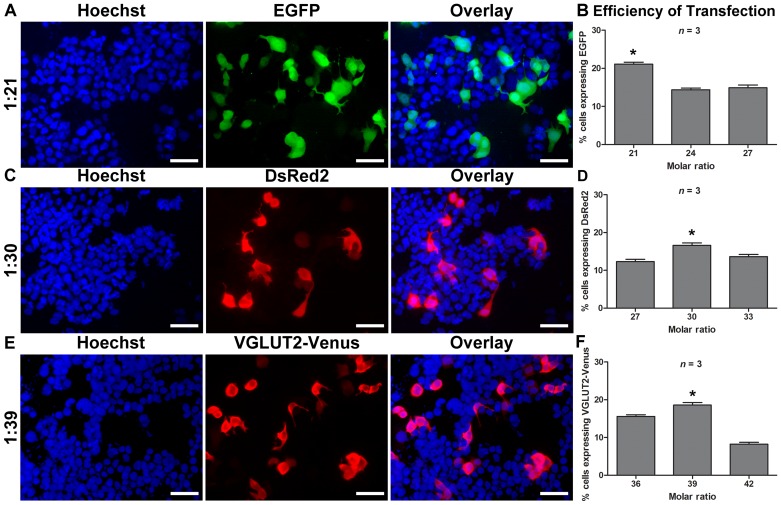
Figure 2. Efficiency of transfection of N1E-115 cells by the NTS-polyplex.
In A, the micrographs illustrate expression of GFP (green), DsRed (red) or VGLUT2-Venus (red). Nuclei were stained with Hoechst 33258 (blue). The images were acquired using a 20× objective. In B, the graphs depict the efficiency of transfection evaluated at different plasmid to NTS-carrier molar ratios. The cell counting for each molar ratio was performed in 5 fields in each coverslip, n = 3. *P<0.05. Scale bar = 50 µm.

