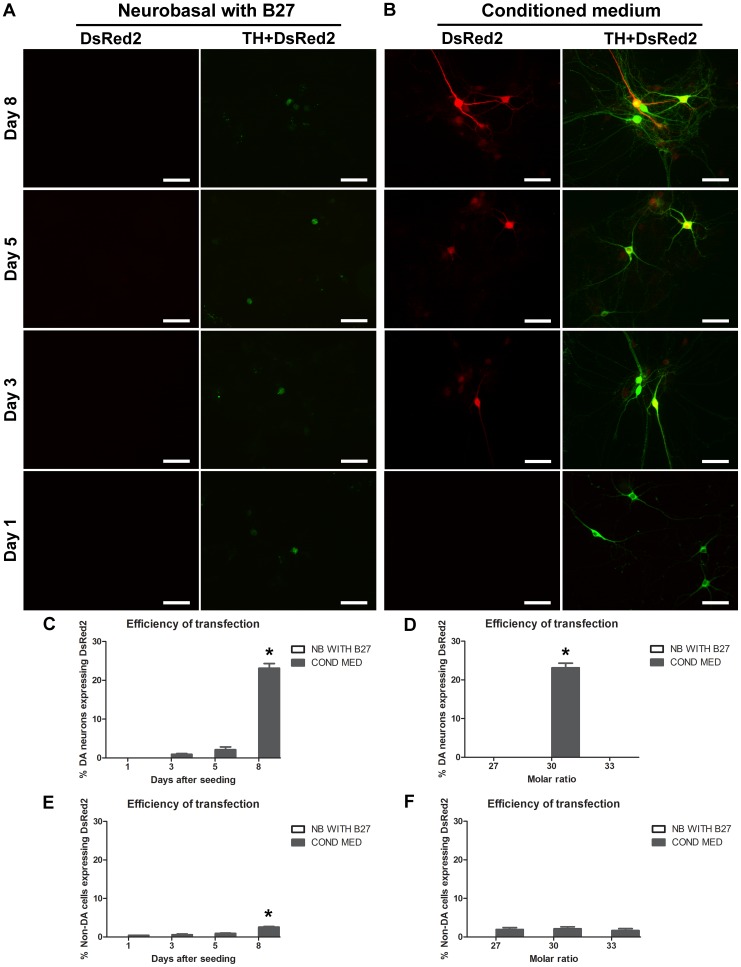
Figure 3. Time course and different molar ratios tested for the transient expression of pDsRed2 using NTS-polyplex.
In A and B, the micrographs illustrate the appearance of TH-positive neurons and the time course of transfection of pDsRed2 with the two different culture media tested. The neurons were processed for TH (green) and DsRed (red) immunocytochemistry. The graphs in C and E correspond to the time course of transfection evaluated in DA and non-DA neurons. The graphs in D and F describe the efficiency of transfection evaluated at different plasmid to NTS-carrier molar ratios in DA and non-DA neurons (day 8 after seeding). The cell counting for each molar ratio and for the time course was performed in 30 fields per coverslip (n = 3 coverslips). Negative controls were also prepared using NTS-carrier without plasmid (not shown). The images were acquired with a 20× objective. *P<0.05. Scale bar = 50 µm.

