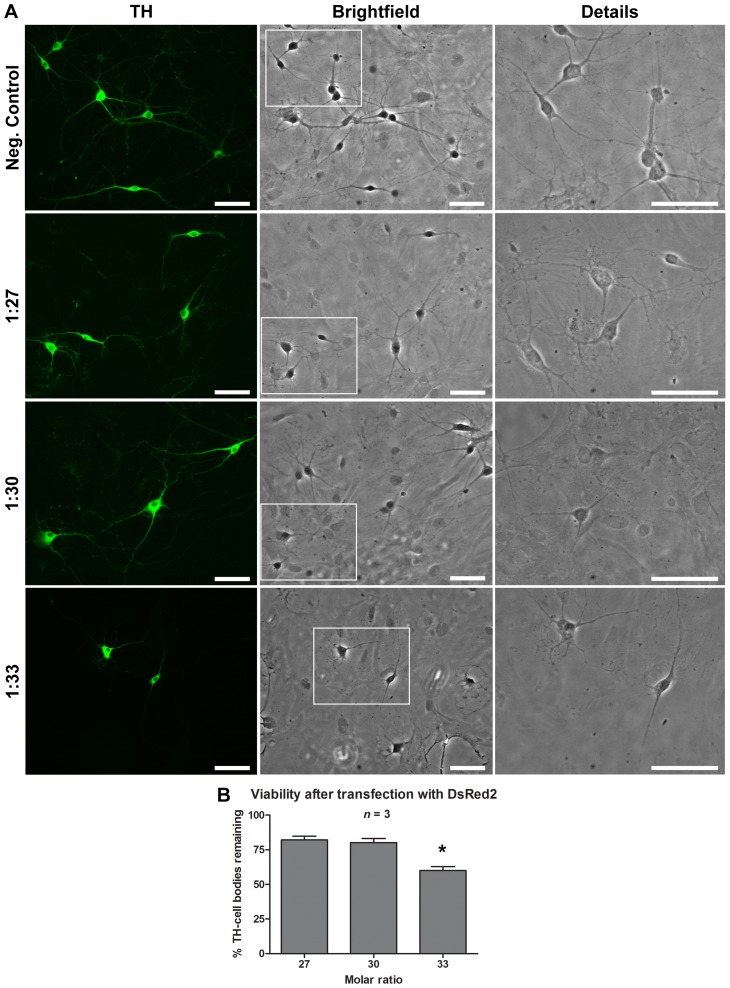
Figure 5. Transfection of pDsRed2 using the NTS-polyplex caused a reduction in DA neuron number only at the highest ratio tested.
Panel A shows phase contrast micrographs illustrating the appearance of DA neurons after transfection using three molar ratios. In B, the graph depicts the average number of TH-positive DA neurons relative to non-transfected controls (%). The neurons were processed for TH immunocytochemistry (green). Negative controls were exposed to NTS-carrier without plasmid. The cell counting was performed from 30 fields per coverslip (n = 3). The images were acquired using a 20× objective. *P<0.05. Scale bar = 50 µm.

