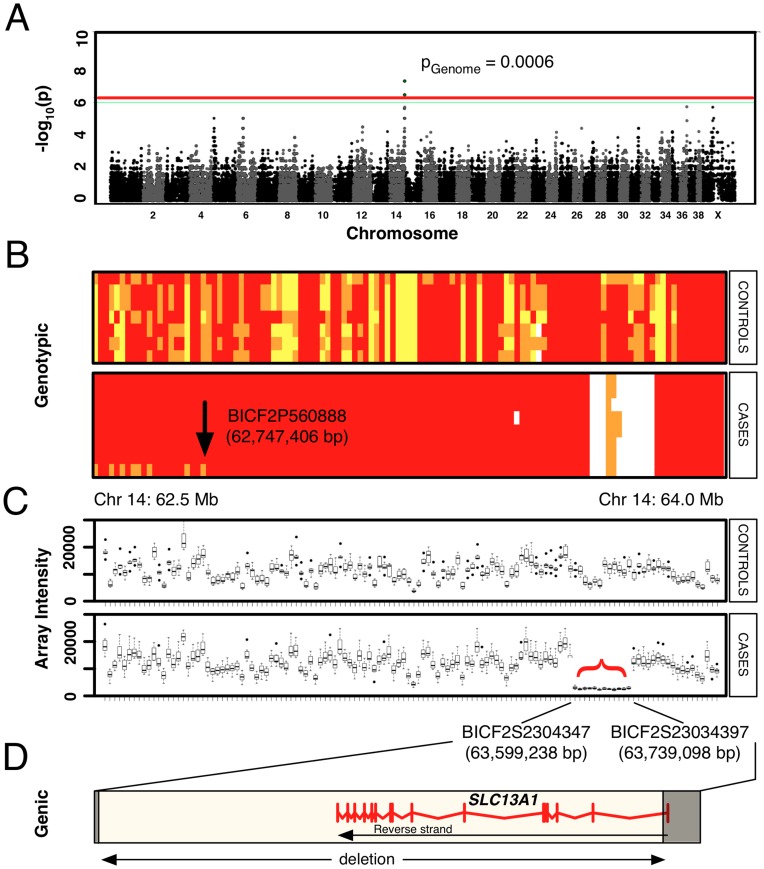
Figure 2. Genetic mapping of the osteochondrodysplasia locus.
(A) Manhattan plot of genome-wide results displaying a statistically significant peak of association on the terminal end of CFA14. Plotted p-values were calculated by Fisher’s Exact Test. The p-values for the six most strongly associated SNPs (overlapping on the graph), adjusted by permutation, were p = 0.0006. (B) Genotypic pattern of SNPs across the interval of interest on CFA14 (62.5–64.0 Mb). Red, major allele in cases; orange, heterozygous SNP genotypes; yellow, homozygous minor allele in cases. Genotype data are shown horizontally for each of seven controls and eight cases. The arrow notes an historical crossover that bounds the ancestral haplotype shared among cases, upon which the founder mutation is predicted to have occurred. Nine SNPs systematically failed in the case samples (white block with orange), suggesting a large deletion. (C) Raw fluorescence intensity readings from the SNP array for loci across the region of interest (62.5–64.0 Mb). Although several SNPs were initially scored heterozygous (orange, in B), the raw intensity data shows systematic failure in cases for all 12 SNPs in this interval (red bracket), relative to controls. (D) The potential deletion was bounded by two SNPs that were scored in cases. The putative deletion includes a single gene, SLC13A1, drawn to scale, with exon structure in red. The location of physical breakpoints that were subsequently cloned are shown as opaque boxes.

