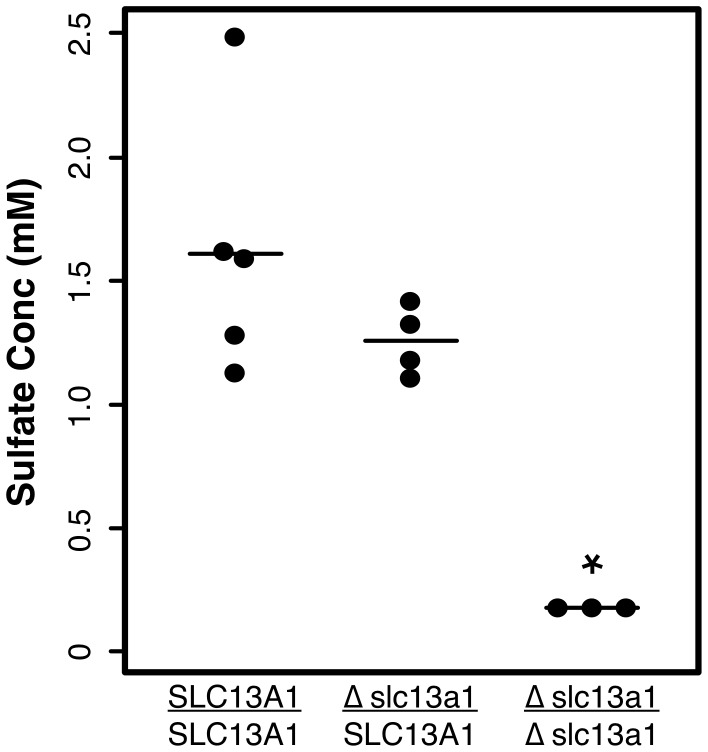
Figure 5. Serum sulfate levels by SLC13A1 genotypic class.
A scatter plot for sulfate concentration measurements from serum obtained from several dogs of each genotypic class: SLC13A1 homozygotes (n = 5); heterozygotes (n = 4); and Δslc13a1 homozygotes (affected dogs; n = 3). The minimum sensitivity threshold for the assay is 0.2 mM. Differences between genotypes were assessed with the Kruskal Wallis test. Although sample sizes were relatively small, the mean sulfate level of affected dogs was significantly lower than the means of the other genotypic classes (p = 0.02).

