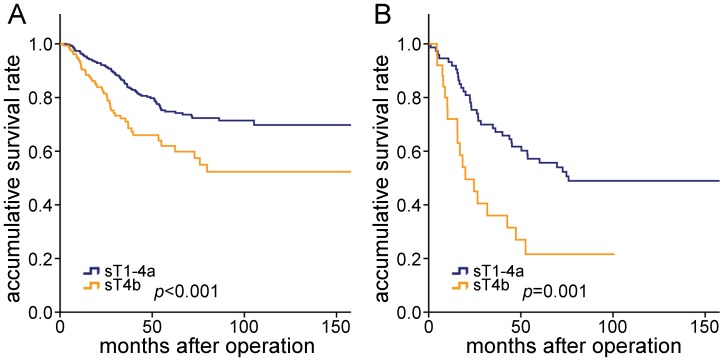
Figure 2. Comparison of survival curves of the patients stratified by pT and sT category.
A, For patients in pT3 category, there was prognostic difference between sT4a and sT4b cancer (P<0.001). B, For patients in pT4a category, there was prognostic difference between sT4a and sT4b cancer (P = 0.001).

