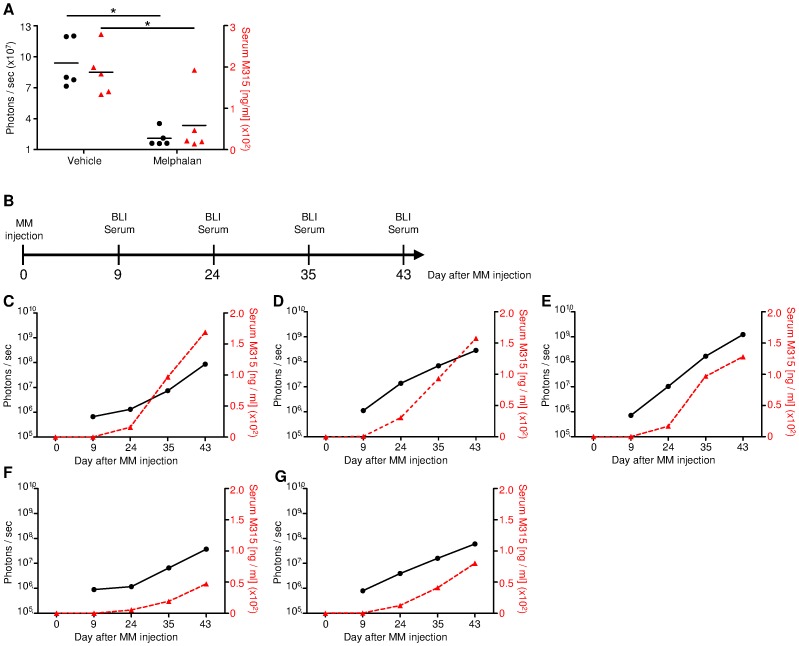
Figure 5. Tumor detection by in vivo BLI correlates to M315 IgA serum measurement by ELISA.
(A) M315 serum levels of melphalan treated (n = 5) and vehicle control (n = 5) on day 14 of treatment and simultaneous BLI measurement of the same mice. The treatment schedule is depicted in Figure 3A. Measurement of idiotype specific M315 IgA significantly differed between the groups (two-tailed p value 0.0171) as it did with BLI (ventral+dorsal signal) (two-tailed p value 0.0221). (B) Scheme indicating time points for BLI measurement and serum collection for data presented in (C–G). (C–G) Idiotype specific M315 IgA serum levels of 5 untreated mice constantly increased over time correlating with progressing tumor burden as measured with BLI (ventral+dorsal signal). Of note, BLI measurements provided signals in early disease stages starting from day +9, whereas M315 IgA levels were not detectable at this time point. The left y-axis displays BLI signal intensity (black circles, solid lines); the right y-axis displays serum M315 IgA (red triangles, dashed lines).

