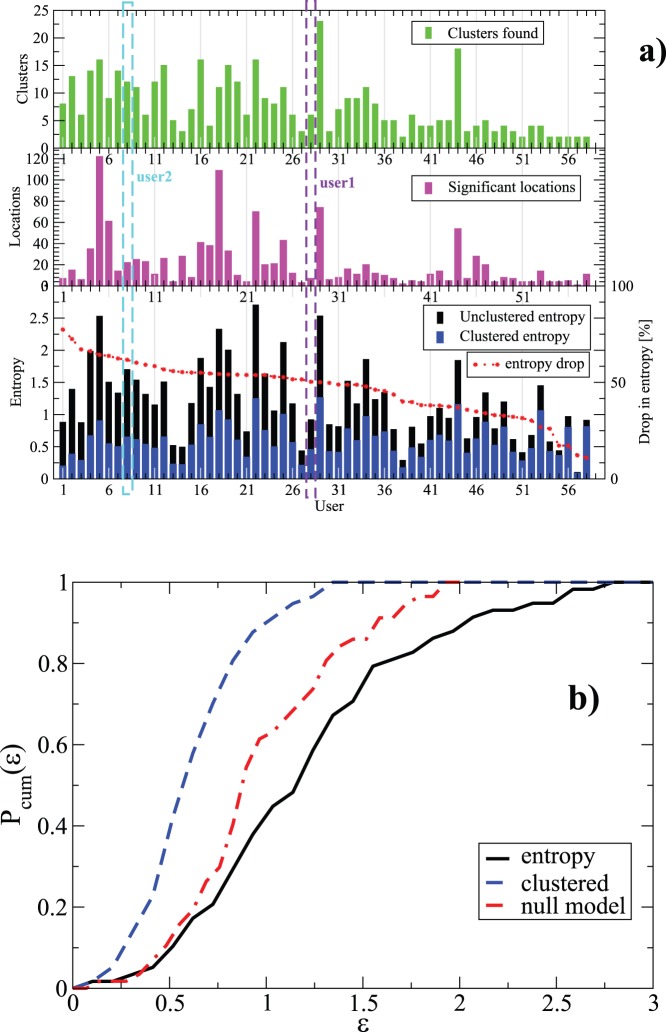
Figure 3. Statistics of patterns, and life entropy.
a) The clustering results for 58 accepted users with the first place definition (off-line clustering) and a time slot of 1 hour. The clustering was done with the EO algorithm and  . b) The cumulative distributions of the entropies for the three cases - bare entropy, reference model, and after clustering.

