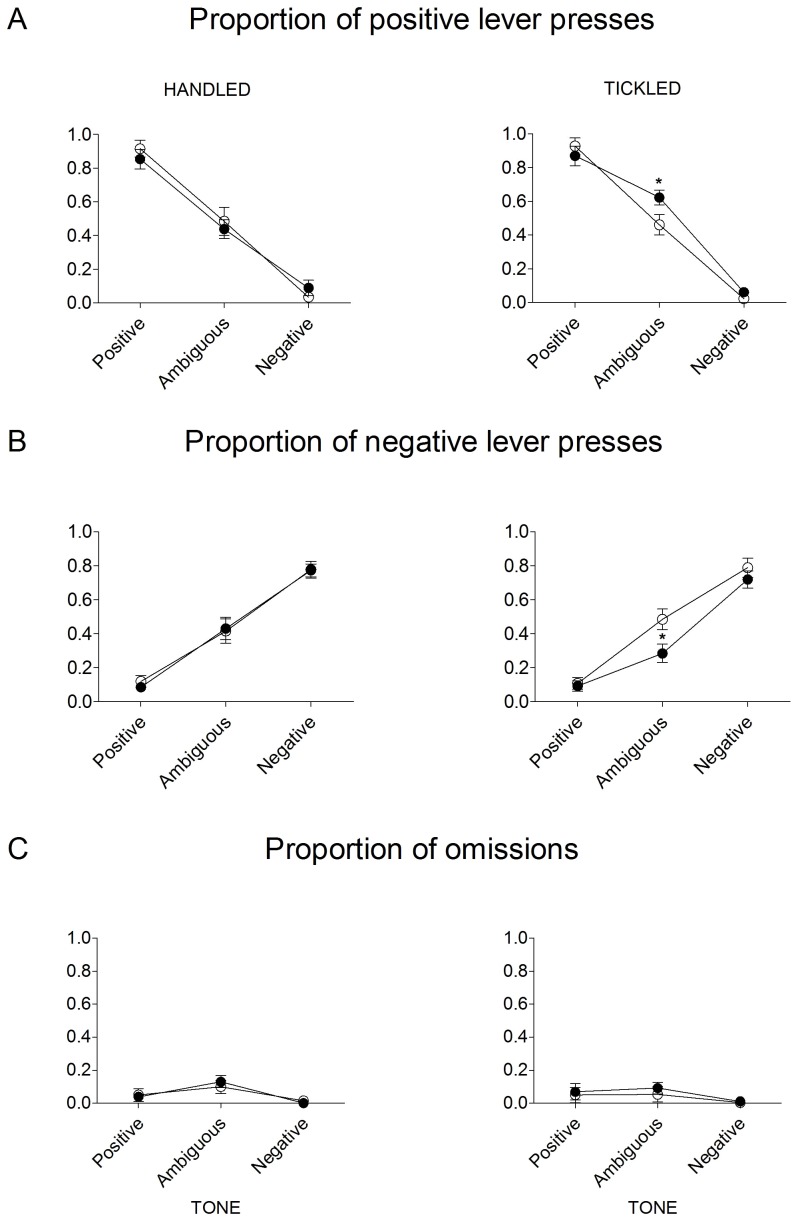
Figure 2. Optimistic bias is specific to the ambiguous cue.
Mean ± SEM proportion of positive, negative and omitted responses to the trained and ambiguous tones in the “Non-laughing when tickled” (open circles, N = 13) and the “Laughing when tickled” (filled circles, N = 13) groups of rats after handling and tickling. * indicates significant (p≤0.05) difference between the “Non-laughing when tickled” and the “Laughing when tickled” groups of rats.

