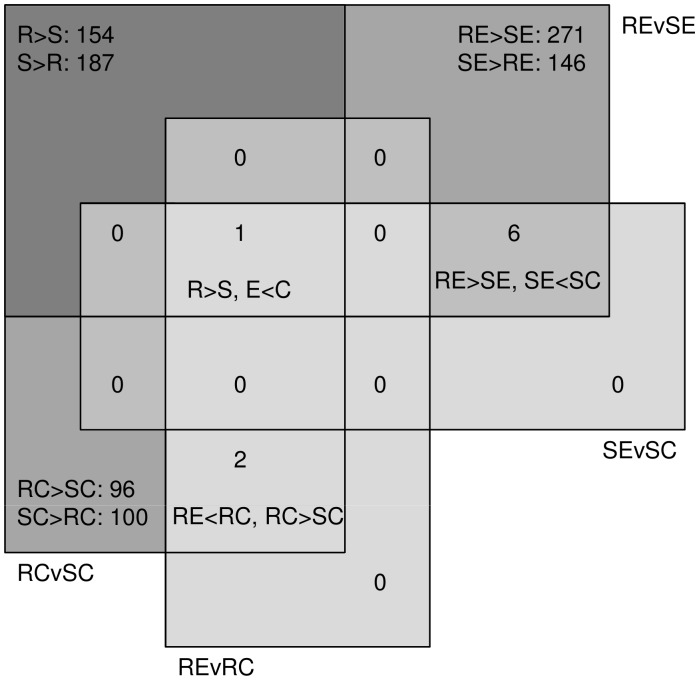
Figure 3. Significant differentially expressed B. glabrata haemocyte genes identified from microarray comparisons.
The Venn diagram shows the number of identified significantly differentially expressed genes in each category. Some genes were identified which were differentially expressed in more than one comparison and hence lie in the overlapping regions of the diagram. Key to symbols: R, resistant B. glabrata; S, susceptible B. glabrata; E, S. mansoni exposed snails; C, control snails. > greater than, < less than.

