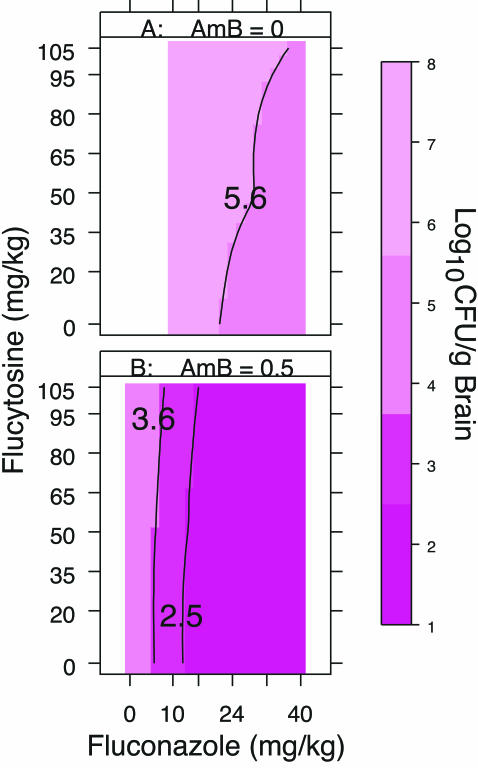
FIG. 6.
Contour plots of the upper limits of the 99% CIs for the numbers of CFU per gram of brain tissue for fluconazole with or without flucytosine and without amphotericin B (A) and with amphotericin B (B). The contours and shades of pink identify dose combinations with similar levels of response. The color key shows the CI level (numbers of log10 CFU per gram of brain tissue) associated with each shade of pink.

