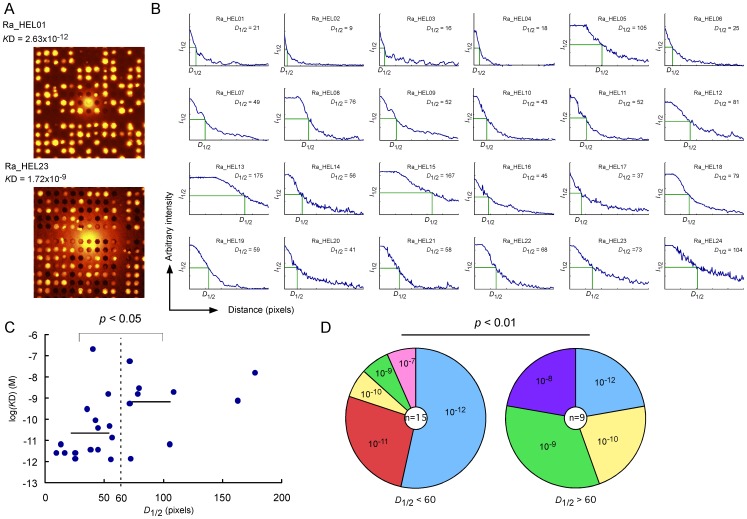
Figure 2. Relationship between rabbit-ISAAC immunospots and affinities.
(A) Representative ISAAC immunospots of secreted HEL-binding RaMoAbs with high (KD: 10−12 M) and low (KD: 10−9 M) affinity. (B) A decay curve of fluorescence intensities in individual ISAAC immunospots. The fluorescence intensity of individual ISAAC immunospots (y-axis) is plotted against the distance (x-axis). I 1/2 is the value at which the immunospot fluorescence intensity reaches 50%, and D 1/2 indicates the distance at which I 1/2 is achieved. The D 1/2 value is shown in each individual plot. (C) Relationship between the D 1/2 of individual immunospots (x-axis) and KD (y-axis). The dotted line indicates D 1/2 = 60. The bar indicates the average KD for antibodies with D 1/2<60 and those with D 1/2>60. The p-value was determined using Student’s t-test. (D) Frequency of antibodies with the indicated order of KD values for antibodies with D 1/2<60 and D 1/2>60. The colored pie segment indicates the frequency of antibodies with the indicated order of KD. The number in the center of the pie chart denotes the number of antibodies analyzed. The p-value was determined using Fisher’s test.

